XLM Price Prediction: Stellar (XLM) Looks Ready for an Uptrend, Regular Bullish Divergence Signals on Intraday Charts


The Stellar Foundation-SDF, a non-profit with a focus on Stellar-based blockchain solutions recently announced an upgrade of the Stellar blockchain to Protocol version 18, a significant milestone for the Stellar ecosystem.
What’s New at Stellar (XLM)?
You may be wondering what makes this a big deal. Well, this upgrade makes it possible for Stellar holders and users to create liquidity pools without smart contracts and high gas fees, making Stellar the only layer-1 platform to activate such a native AMM [Automated Market Maker] functionality.
- Furthermore, Stellar (XLM) holders can leverage its products and inject liquidity for cross-asset conversions.
- As per a recent report, Stellar’s liquidity pools will retain a 0.3% negligible fee from liquidity providers at first.
Let’s proceed to analyze the XLMBTC and XLMUSDT price charts and gain further insights into how the recent events may affect the current XLM price.
XLM Price Prediction: XLMBTC Weekly Chart
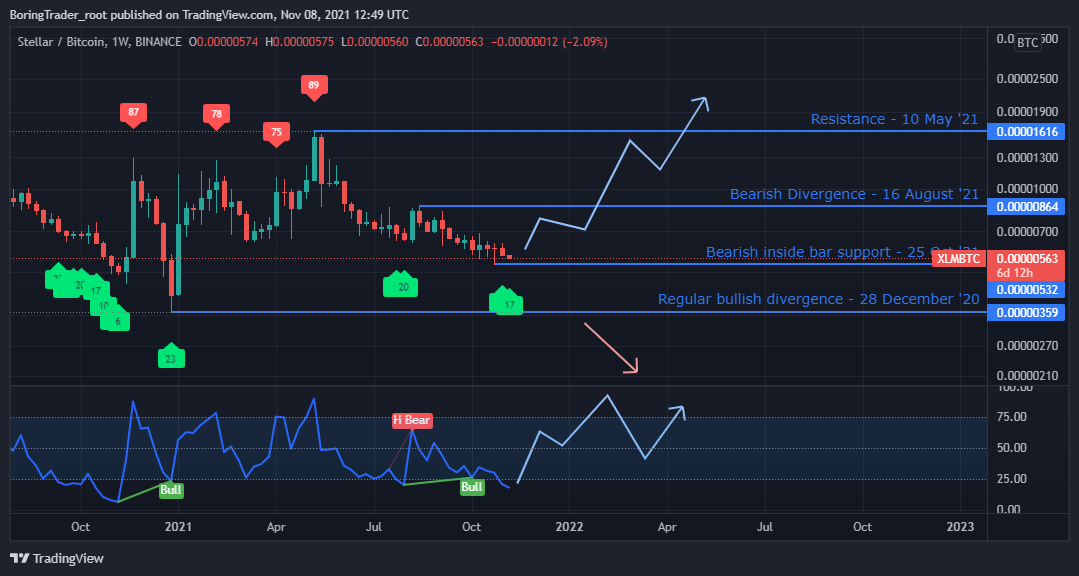
The XLMBTC chart shows high demand for BTC compared to XLM. However, we could see a switch in trend polarity with higher RSI values above level-75 and level-25 going forward into the week.
XLM Price Prediction: XLMUSDT Weekly Chart
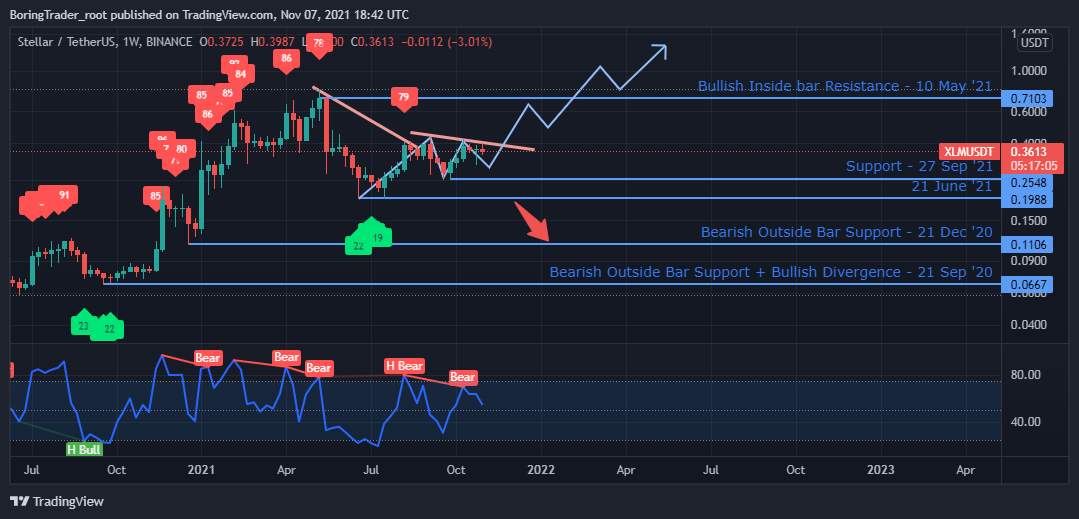
Beginning with the weekly time frame overview of the XLMUSDT, the crypto pair fixes a price floor at 0.1988 after entering the oversold area on 21 June ’21, and slowly transition into an uptrend with the RSI climbing above level-75 on 09 August ’21.
A weekly price close above the recent bearish divergence resistance [0.4207] will confirm our decision to enter a long position with confidence into the XLMUSDT.
Conversely, a collapse of the 0.1988 support will suggest further bearish sentiment for the XLM against the USDT.
XLM Price Prediction: XLMUSDT Daily Chart
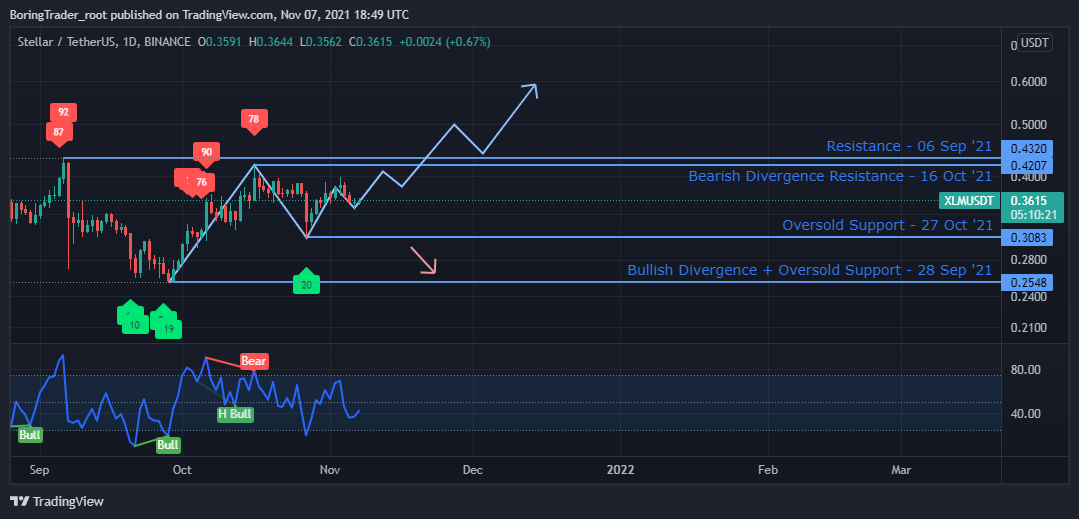
The daily chart overhead also reveals a resistance level set up by bearish divergence patterns on 16 October ’21.
There are obviously three scenarios from this point, with the first being a breakout above the crucial $0.4207 resistance. A second scenario would be that the price could trade within the $0.4207 and $0.3083 price range. The third scenario would be a breakdown of the 0.3081 support for a deeper correction of the current price recovery.
We, however, maintain a positive bias toward the XLMUSDT pair, following the first scenario for a breakout to the upside.
XLM Price Prediction: XLMUSDT 4 HR Chart
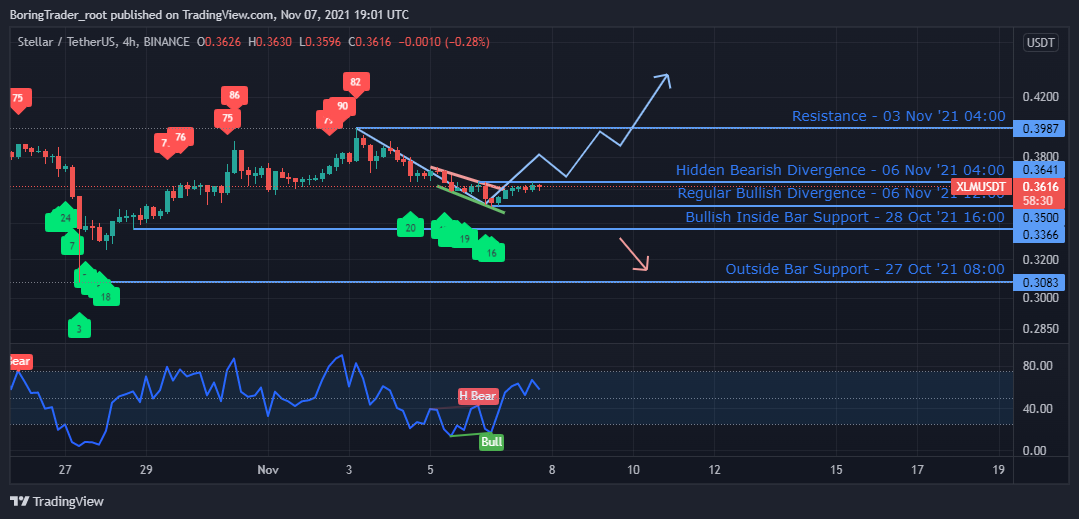
A view into the intraday 4HR chart reveals a possible price floor in the works, after a recent regular bullish divergence on 06 November and a breakout of bearish divergence resistance.
We could see a higher XLM price with a break above the 0.3987 resistance to confirm our bullish bias.

Why Trust CoinGape
CoinGape has covered the cryptocurrency industry since 2017, aiming to provide informative insights Read more… to our readers. Our journal analysts bring years of experience in market analysis and blockchain technology to ensure factual accuracy and balanced reporting. By following our Editorial Policy, our writers verify every source, fact-check each story, rely on reputable sources, and attribute quotes and media correctly. We also follow a rigorous Review Methodology when evaluating exchanges and tools. From emerging blockchain projects and coin launches to industry events and technical developments, we cover all facets of the digital asset space with unwavering commitment to timely, relevant information.

Delivered every day.
- Insights that move markets
- 100,000 active subscribers
Related Articles


- Trump’s Truth Social Files For Bitcoin, Ethereum, Cronos Crypto ETFs Amid Institutional Outflows
- Trump Tariffs: U.S. Supreme Court Sets February 20 for Potential Tariff Ruling
- Brazil Targets 1M BTC Strategic Reserve to Rival U.S. Bitcoin Stockpile
- Breaking: U.S. CPI Inflation Falls To 4-Year Low Of 2.4%, Bitcoin Rises
- Bitget Launches Gracy AI For Market Insights Amid Crypto Platforms Push For AI Integration
- Bitcoin Price Outlook As Gold And Silver Lose $3.6 Trillion in Market Value
- XRP and Ethereum Price Prediction as Trump Seeks to Lower Key Tariffs
- Solana Price Prediction as $2.6 Trillion Citi Expands Tokenized Products to SOL
- Bitcoin Price Could Fall to $50,000, Standard Chartered Says — Is a Crash Coming?
- Cardano Price Prediction Ahead of Midnight Mainnet Launch
- Pi Network Price Prediction as Mainnet Upgrade Deadline Nears on Feb 15


