Apecoin Price Analysis: Rising Supply Pressure May Tumble APE By 17%


The ongoing recovery rally in APE price stalled at $7.23 resistance. Despite showcasing several attempts to breach this barrier, the buyers couldn’t surpass the $7.23 mark in the past four days. Even today, the coin price is 3.75% up, but the long rejection attached to it indicates another failed attempt from buyers.
Key points:
- The $7.23 breakout would trigger a directional rally in APE
- A breakdown below $5.52 would imply weakness in buyers’ commitment
- The intraday trading volume in the APE is $575.5 Million, indicating a 53.4% gain
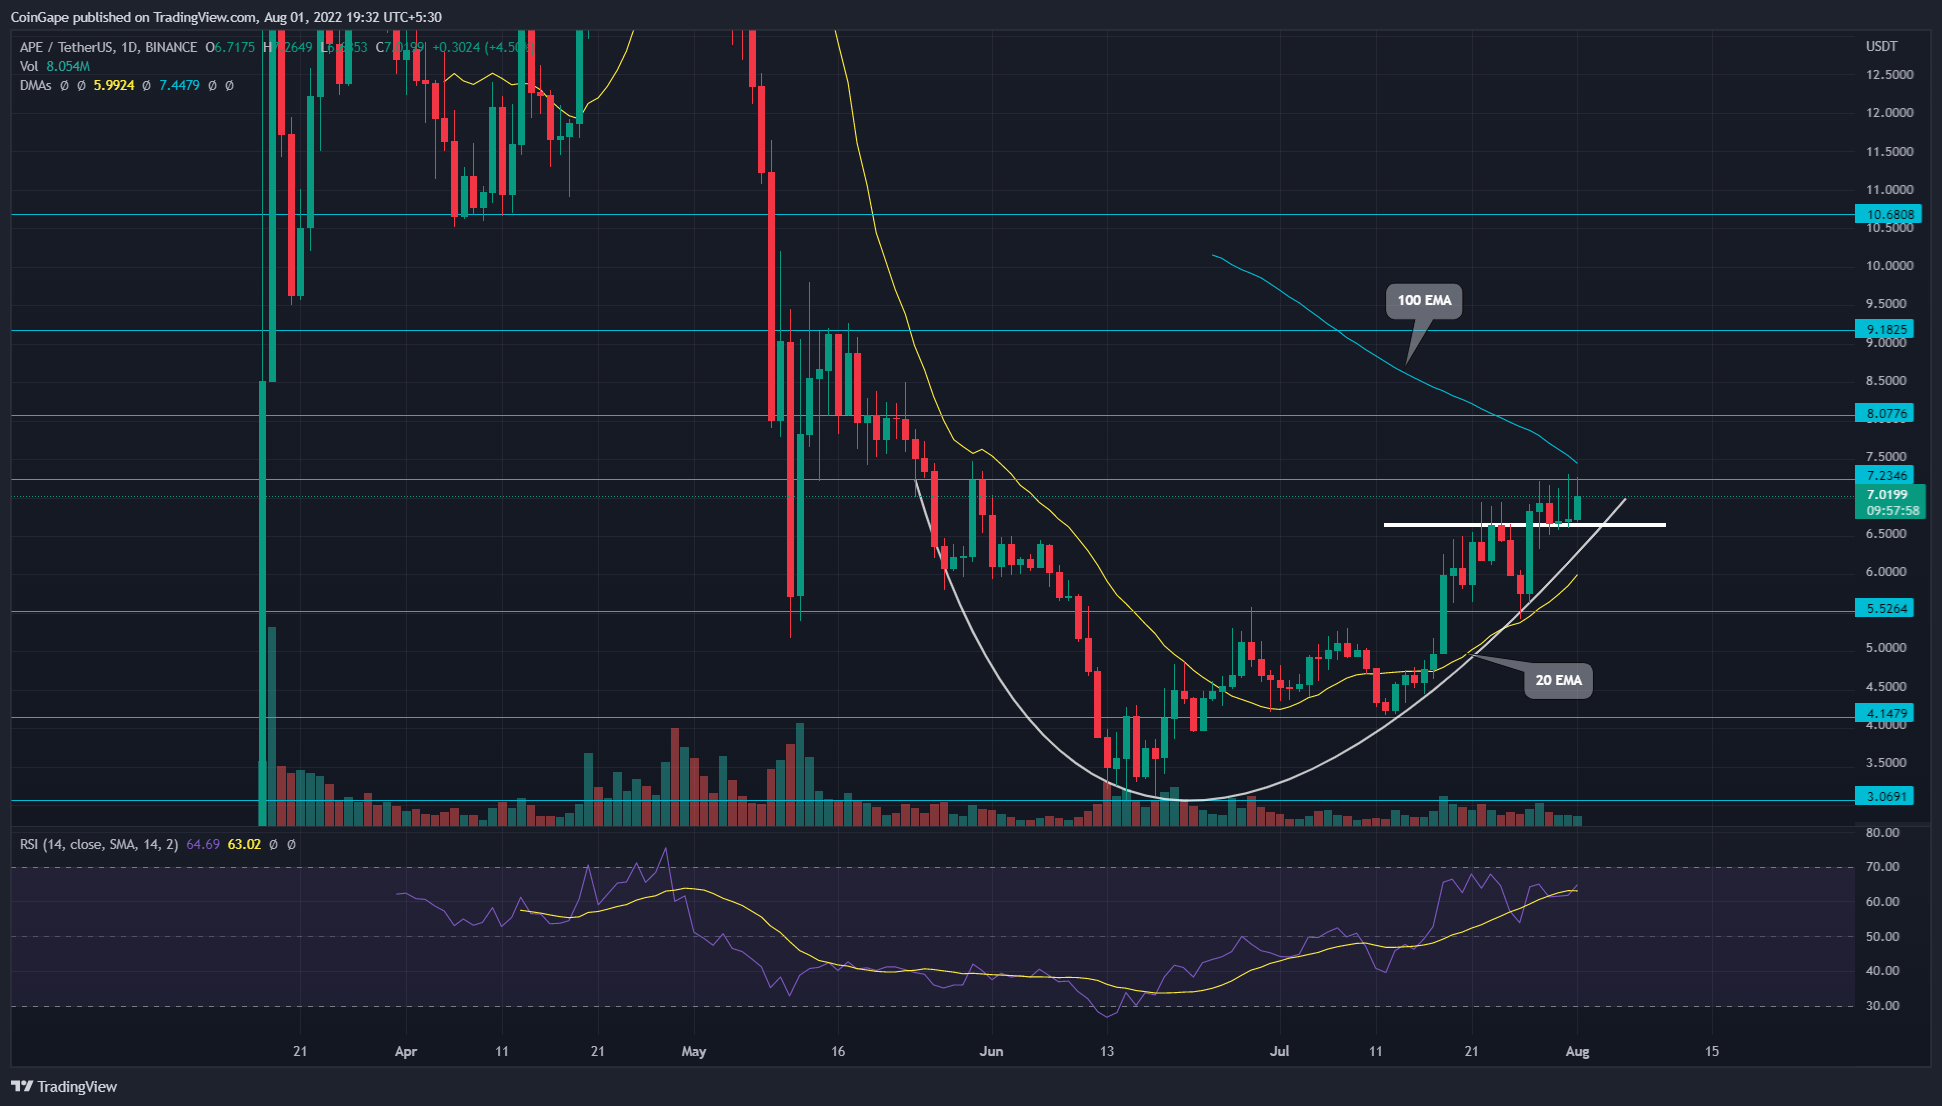 Source- Tradingview
The APE/USDT downfall took a complete turnaround after the price hit a $3.09 low. Amidst the improving market sentiment, the price action knocked out multiple resistance levels and showed a constant rally since last month.
On July 28, the bull-run tagged the $7.23 mark, registering a 138% growth since the mentioned low. However, the APE price showed several attempts to breach the overhead resistance, but all ended with long-wick rejection candles.
These failed trials hint the bullish momentum is exhausted, and the price may witness a significant correction before resuming the recovery rally. Furthermore, the price action shows a minor support level at the $6.63 mark, indicating a narrow consolidation.
Therefore, the daily candlestick closing beyond either barrier of the constitution will determine further movement in APE price.
Thus, if the sellers pull the altcoin below the $6.63 support, the traders may witness a 17% correction to the $5.52 support. However, losing this support would indicate weakness in bullish momentum, leading to further downfall to the $4.14 mark.
On the other hand, a candle closing above the $7.23 resistance will offer another breakout opportunity to buyers with a 26.7% higher target of $9.18.
Technical indicator
EMAs- The downsloping 100 DMA line is nearing to APE price would add additional selling pressure on traders. On the flip side, the short-term recovery is led by the dynamic support of the 20 DMA.
RSI indicator– a slight bearish divergence in RSI slope concerning the new higher high in price supports the pullback theory.
- Resistance levels- $7.23 and $8
- Support levels- $6.63 and $5.2
Instant Currency Exchange at BestChange with Ease
- Compare Rates Across 1000+ Exchanges
- Access 250+ Cryptocurrencies & Pairs
- Save Time with Real-Time Price Tracking


Why Trust CoinGape
CoinGape has covered the cryptocurrency industry since 2017, aiming to provide informative insights Read more…to our readers. Our journal analysts bring years of experience in market analysis and blockchain technology to ensure factual accuracy and balanced reporting. By following our Editorial Policy, our writers verify every source, fact-check each story, rely on reputable sources, and attribute quotes and media correctly. We also follow a rigorous Review Methodology when evaluating exchanges and tools. From emerging blockchain projects and coin launches to industry events and technical developments, we cover all facets of the digital asset space with unwavering commitment to timely, relevant information.