Aave and Sushiswap Price Analysis: De-Fi Coins On A Rise, Register Over 7% Hike


Over the last 24 hours, the crypto industry traded in the red, although some coins had already embarked on a northbound journey. Aave had risen by 9.6% in the last 24 hours, while SushiSwap had logged a gain of 7.1% within the same time frame.
Near-term technicals of both the coins indicated positive price action on their respective charts. Both the coins toppled over their resistance lines and saw the entry of buyers into the market. Aave was trading for $262.94 while SushiSwap was exchanging hands at $10.77.
Aave/USD Four Hour Chart
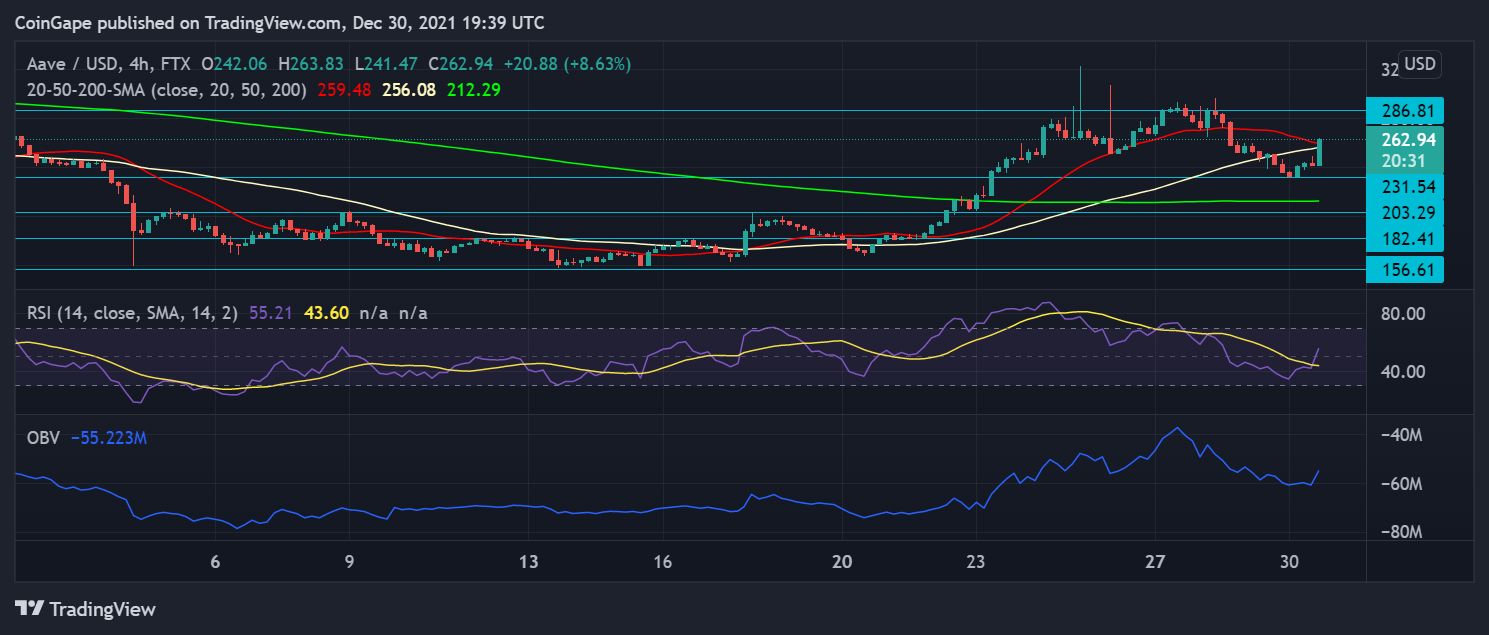
Aave was trading above the support line of $231.54 as it recovered slightly overnight. On the four-hour chart, the coin was placed above the 20-SMA mark, which meant that the buyers were more in number than the sellers in the market.
The coin could target its overhead ceiling at the $286.81 level with a consistent buying strength. Its support level stood at $231.54, falling beneath which the coin could trade close to $203.29. Aave’s price trajectory was bullish ever since December 20; however, the coin also witnessed patches of downward price action, but Aave was quick to recover from that.
The Relative Strength Index noted an uptick which signified increased buying strength as the indicator preferred the bulls. On Balance Volume also chose to side with the bulls as the indicator had shot up, signifying that buyers exceeded sellers in the market.
Sushi/USD Four Hour Chart
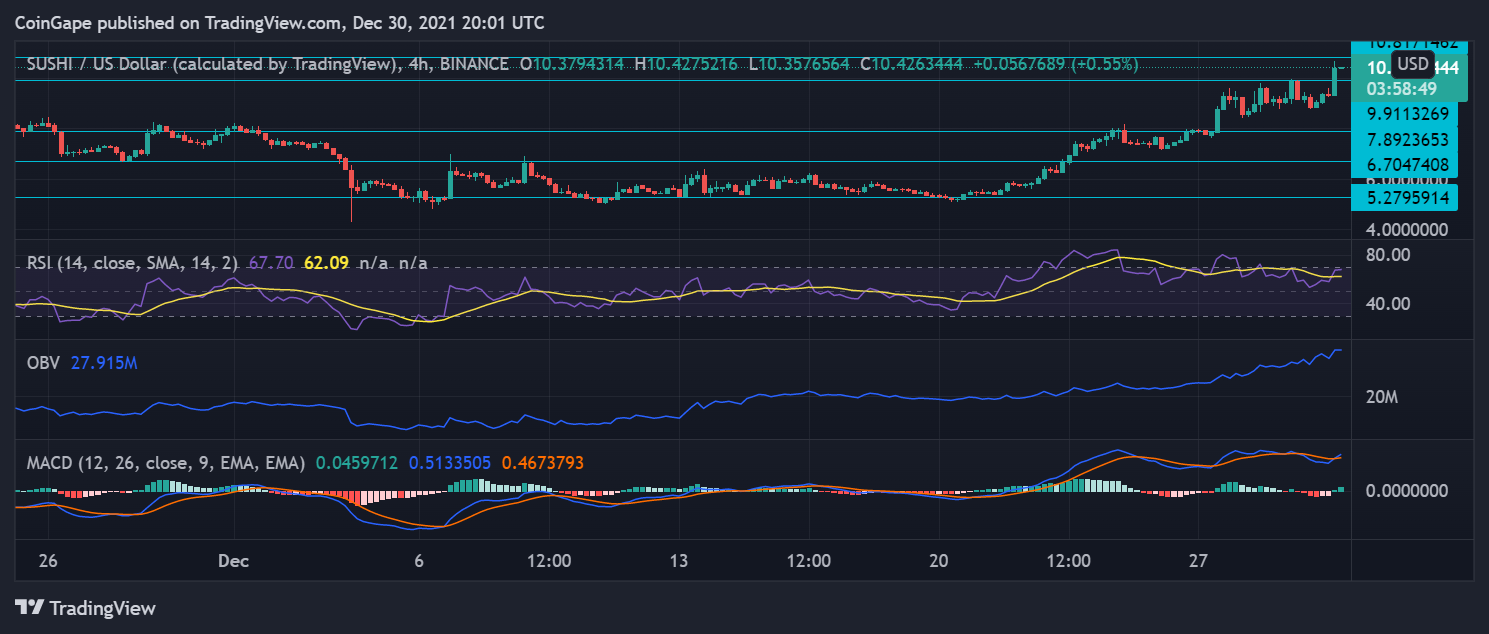
SushiSwap had shown impressive growth over the past week and a half. It had recently broken above the $9.91 mark and was seen trading in double digits at the time of writing. The immediate price level in the event of a pullback stood at $7.89.
The overhead price level stood at $10.88, while the other resistance level was at $11.59. Over the last week, Sushi gave 60.8% returns on its ROI, which is quite massive among the returns incurred by the top De-Fi coins.
The Relative Strength Index was hovering near the 75-mark, suggesting excess buying pressure as the asset was overbought at the time of writing. On Balance, Volume was on a steady incline, telling that selling volume was low as buying volume and pressure consistently was picking up. MACD was bullish too, with green histograms after the indicator underwent a bullish crossover.

Why Trust CoinGape
CoinGape has covered the cryptocurrency industry since 2017, aiming to provide informative insights Read more… to our readers. Our journal analysts bring years of experience in market analysis and blockchain technology to ensure factual accuracy and balanced reporting. By following our Editorial Policy, our writers verify every source, fact-check each story, rely on reputable sources, and attribute quotes and media correctly. We also follow a rigorous Review Methodology when evaluating exchanges and tools. From emerging blockchain projects and coin launches to industry events and technical developments, we cover all facets of the digital asset space with unwavering commitment to timely, relevant information.

Delivered every day.
- Insights that move markets
- 100,000 active subscribers
Related Articles


- Crypto Prices Surge Today: BTC, ETH, XRP, SOL Soar Despite US Government Shutdown
- CLARITY Act: Crypto Group Challenges Banks Proposal With Its Own Bill Suggestions
- Trump’s Truth Social Files For Bitcoin, Ethereum, Cronos Crypto ETFs Amid Institutional Outflows
- Trump Tariffs: U.S. Supreme Court Sets February 20 for Potential Tariff Ruling
- Brazil Targets 1M BTC Strategic Reserve to Rival U.S. Bitcoin Stockpile
- XRP Price Prediction Ahead of Potential U.S. Government Shutdown Today
- Bitcoin Price Outlook As Gold And Silver Lose $3.6 Trillion in Market Value
- XRP and Ethereum Price Prediction as Trump Seeks to Lower Key Tariffs
- Solana Price Prediction as $2.6 Trillion Citi Expands Tokenized Products to SOL
- Bitcoin Price Could Fall to $50,000, Standard Chartered Says — Is a Crash Coming?
- Cardano Price Prediction Ahead of Midnight Mainnet Launch


