Binance (BNB) Price Analysis: On-chain Data Shows Rise In Demand for the BNB Coin, Will BNB Outperform BTC?


Why Is Binance Coin (BNB) Price Surging? Among many reasons recent 1 billion USD fund for project development of DApps on the Binance Smart Chain [BSC] is one major catalyst fueling the BNB price.
The crypto data tracking service, Santiment spotted an increase in demand for BNB on wallets with BNB whales acquiring roughly 412K BNB in recent weeks. The move shows that big money remains bullish on the BNB coin in the face of regulations.
The BNB burn protocol is another interesting bullish catalyst for the BNB token price as the bulls hold on to their positions in wait for this event.
A dive into the price chart should also give us further insights into significant patterns and technical drivers of the BNB price.
Binance (BNB) Weekly Chart Analysis
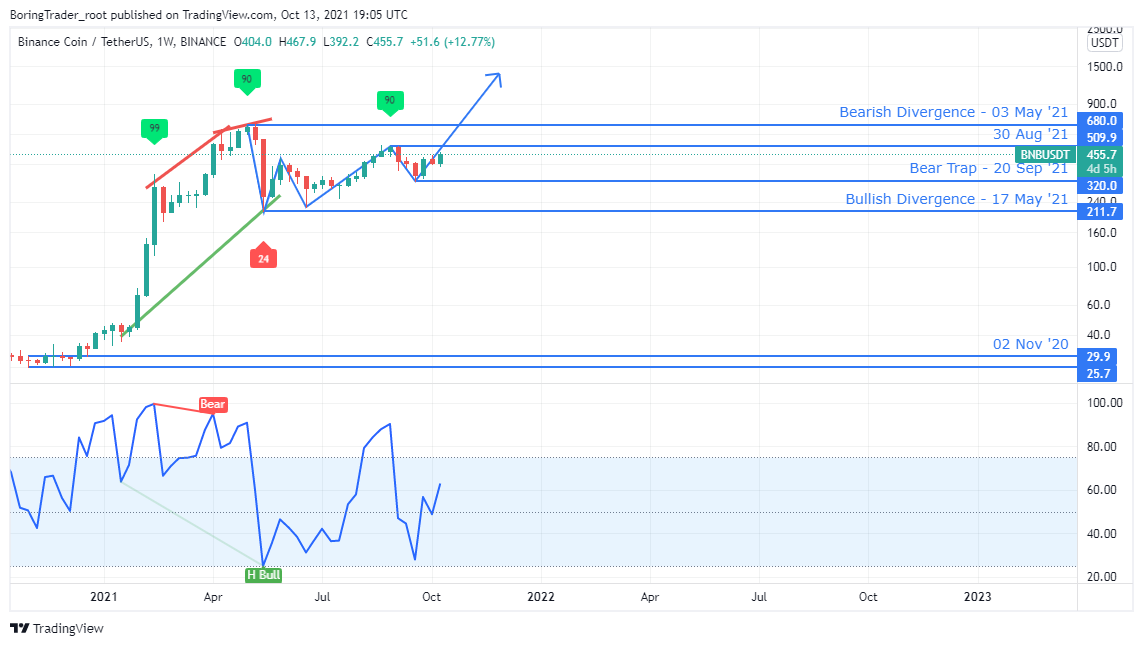
Both bearish and bullish divergence price vs. oscillator patterns keeps the BNB price hovering within the $680 resistance and $211.70 support.
The recent bear trap candlestick pattern on 20 September prepares a bullish tone for a price increase beyond the $509.90 resistance and heading to the $680.00 ATH.
The RSI [4] couldn’t reach level-25, which therefore represents a bullish outlook for the BNB price.
A breakout above the $680 resistance could see the BNB price rising into four-figure price zones for the first time.
Binance (BNB) Daily Chart Analysis
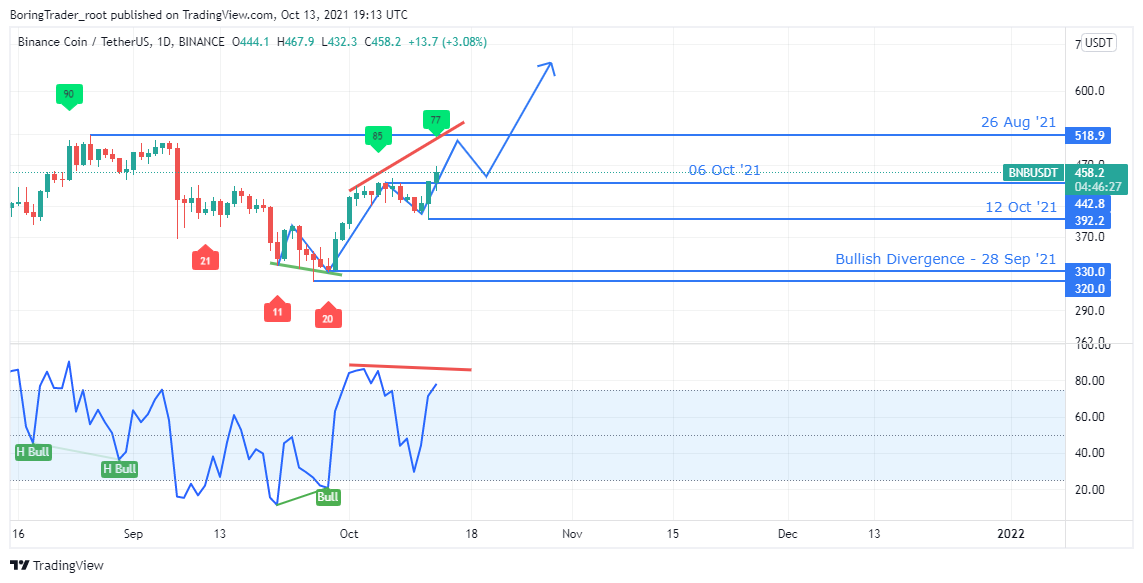
Following a collapse of hidden bullish divergence trend lines on 07 September ‘21, the BNBUSDT price slumped by roughly 23%, then quickly reversed to the upside by an opposing regular bullish divergence on 28 September ’21.
The bulls have re-established control as the RSI enters the overbought area for the second time at press time.
Meanwhile, an impending bearish divergence setup is projected around the $518.90 resistance. On the other hand, a surge in bullish momentum may see the RSI shooting beyond the 85-level, therefore, nullifying the anticipated reversal pattern.
Binance (BNB) 4HR Chart Analysis
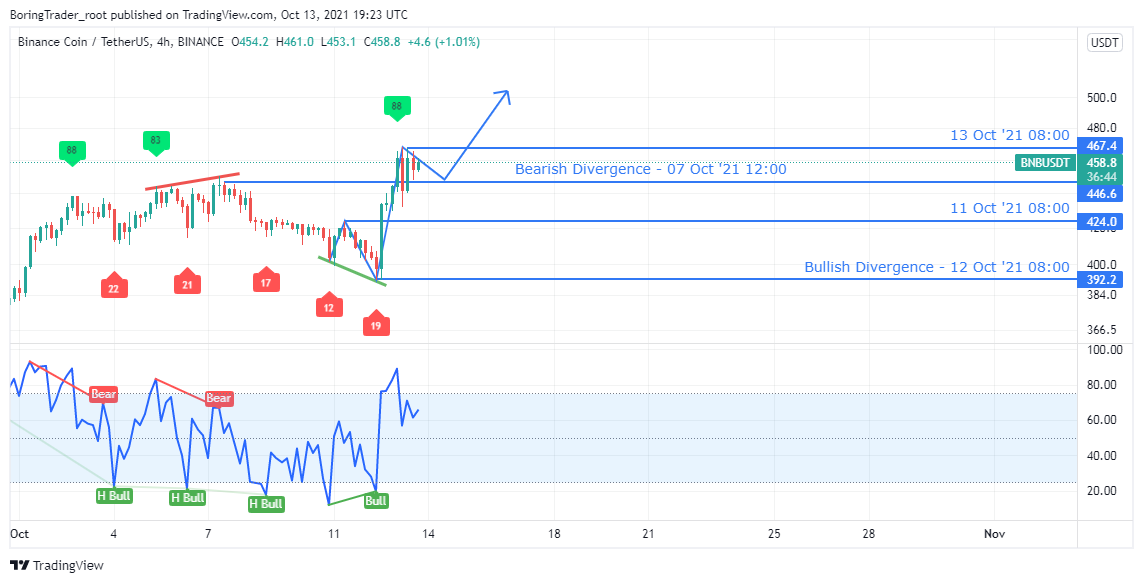
The 4HR time frame follows a similar price dynamics as the daily time frame with an opposing regular bullish divergence on 12 October ’21 at 08:00. This led to a parabolic upswing for the BNB price and soaring above the 07 October 12:00 resistance [$446.60].
Raging bulls could use the old $446.60 resistance as new support, which is a possible upward scenario for the BNB price. A prolonged correction phase could see the price dropping to the $424.00 support.
Binance (BNB) Intraday Levels
- Spot rate: 468.4
- Mid–Term Trend [H4]: Strong Bullish
- Volatility: High
- Support: $392.20, $424.0, and $446.60
- Resistance: $473.0 and $518.90

Why Trust CoinGape
CoinGape has covered the cryptocurrency industry since 2017, aiming to provide informative insights Read more… to our readers. Our journal analysts bring years of experience in market analysis and blockchain technology to ensure factual accuracy and balanced reporting. By following our Editorial Policy, our writers verify every source, fact-check each story, rely on reputable sources, and attribute quotes and media correctly. We also follow a rigorous Review Methodology when evaluating exchanges and tools. From emerging blockchain projects and coin launches to industry events and technical developments, we cover all facets of the digital asset space with unwavering commitment to timely, relevant information.
Delivered every day.
- Insights that move markets
- 100,000 active subscribers
Related Articles


- XRP News: Ripple Taps Zand Bank to Boost RLUSD Stablecoin Use in UAE
- BitMine Keeps Buying Ethereum With New $84M Purchase Despite $8B Paper Losses
- Polymarket Sues Massachusetts Amid Prediction Market Crackdown
- CLARITY Act: Bessent Slams Coinbase CEO, Calls for Compromise in White House Meeting Today
- Crypto Traders Reduce Fed Rate Cut Expectations Even as Expert Calls Fed Chair Nominee Kevin Warsh ‘Dovish’
- XRP Price Prediction Ahead of White House Meeting That Could Fuel Clarity Act Hopes
- Cardano Price Prediction as Bitcoin Stuggles Around $70k
- Bitcoin Price at Risk of Falling to $60k as Goldman Sachs Issues Major Warning on US Stocks
- Pi Network Price Outlook Ahead of This Week’s 82M Token Unlock: What’s Next for Pi?
- Bitcoin and XRP Price Prediction as China Calls on Banks to Sell US Treasuries
- Ethereum Price Prediction Ahead of Feb 10 White House Stablecoin Meeting


