
BTC Price Fears Dropping 13%; Sell or Hold?


Bitcoin is nowhere close to an immediate recovery now that declines have started a new phase below $29,000. Its trading volume soared to $16 billion on Thursday, but largely due to a bearish wave sweeping across the crypto market.
Down 2.3%, Bitcoin price is trading at $28,230 on Thursday and starting at a possible drop below $25,000 before the next major rebound occurs.
Bitcoin Could Breakout of Sideways Trading
Bitcoin and the crypto market have once again been spooked by inflation in the United States after the Federal Reserve released minutes of the meeting in July used to deliberate how the monetary policy would play out in the coming months.
In the minutes, the Federal Open Markets Committee (FOMC) opined that without interest rate hikes, inflation was likely to stay elevated. After pausing the rate hikes in June, the bank resumed with a 25-basis point hike in July – a factor that does not sit well with investors in risk assets like BTC.
“With inflation still well above the Committee’s longer-run goal and the labor market remaining tight, most participants continued to see significant upside risks to inflation, which could require further tightening of monetary policy,” the minutes read in part.
Bitcoin and altcoins encountered headwinds following the release of the FOMC minutes despite the regulator seeming uncertain about the impact of the longstanding tight monetary policy.
Looking at a Potential 13% Crash
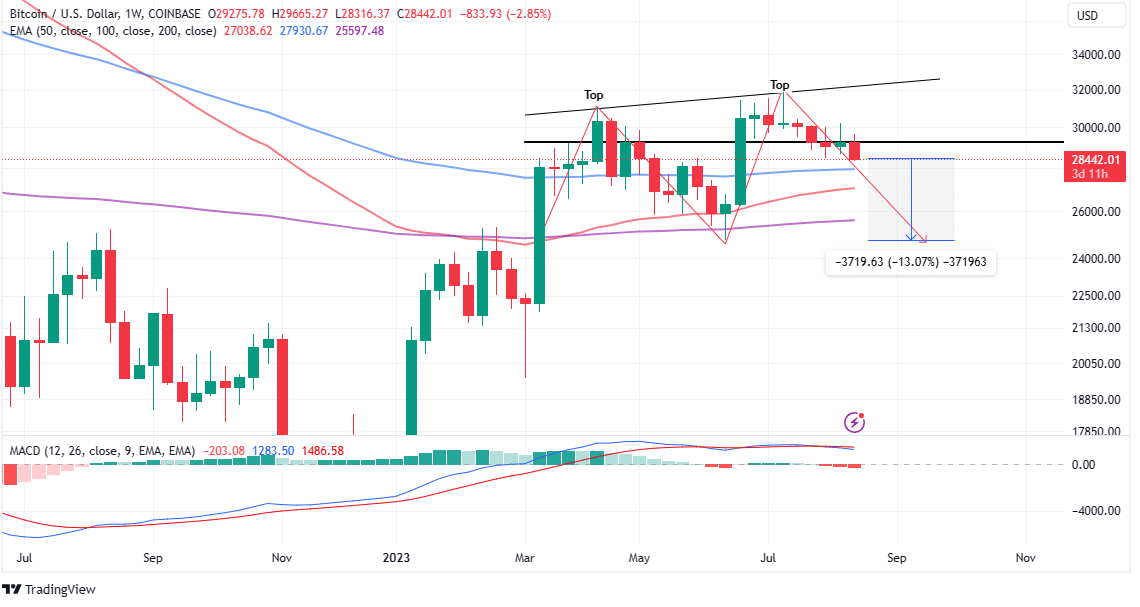
The daily chart reveals the formation of a double-top pattern, which would call for a 13% drop in BTC price to complete.
This is a bearish reversal signal that occurs when an asset reaches a high price twice with a moderate decline in between. It shows that the BTC price faced resistance at the high level of around $32,000 and failed to break through.
The pattern is confirmed when the price falls below a support level equal to the low between the two highs. With the pattern, traders anticipate a downward trend and sell-off or short BTC before it drops further.
According to analysts at Rekt Capital, “BTC would need to drop an additional -9% to -13% from current prices to complete its potential Double Top.”
The Moving Average Convergence Divergence (MACD) indicator shows that sellers have the upper hand and Bitcoin could carry on with its downward trip toward the major support at $25,000.
A sell signal from the momentum indicator manifests with the MACD line in blue crossing below the signal line in red. The red histograms add credence to the bearish outlook.
If support by the 100-day Exponential Moving Average (EMA) (blue) comes in handy at $27,931, Bitcoin could witness a knee-jerk reaction – abandon the drop to $25,000 and launch another attack at $30,000 and $32,000 resistance level, respectively.
Related Articles
Play 10,000+ Casino Games at BC Game with Ease
- Instant Deposits And Withdrawals
- Crypto Casino And Sports Betting
- Exclusive Bonuses And Rewards


Why Trust CoinGape
CoinGape has covered the cryptocurrency industry since 2017, aiming to provide informative insights Read more… to our readers. Our journal analysts bring years of experience in market analysis and blockchain technology to ensure factual accuracy and balanced reporting. By following our Editorial Policy, our writers verify every source, fact-check each story, rely on reputable sources, and attribute quotes and media correctly. We also follow a rigorous Review Methodology when evaluating exchanges and tools. From emerging blockchain projects and coin launches to industry events and technical developments, we cover all facets of the digital asset space with unwavering commitment to timely, relevant information.

Delivered every day.
- Insights that move markets
- 100,000 active subscribers


- TRUMP Coin Whales Reach 5-Month High Ahead Gala Luncheon For Top Token Holders
- CLARITY Act: Crypto Industry and Banks Near Deal as Bill’s Odds Jump Above 60%
- Breaking: Trump Says Iran Wants To Make A Deal With U.S., Bitcoin Rises
- Top 3 factors Why XRP Price is Skyrocketing Today (16th March)
- Ethereum Targets $4K as Peter Brandt Flags Potential ETH Bottom
- MSTR Stock Prediction as Strategy Makes Largest Bitcoin Purchase in 2026 and Analyst Targets BTC Price $100K
- Pi Network Price Prediction After Smart Contract and Second Migration Launch
- Pepe Coin Price Surges 20%- How High Can it Go in March?
- Is XRP Price Gearing Up For $2 Level As BTC Rebounds Above $74k?
- Cardano’s $0.50 Resistance- Can “Midnight” Alpha Defy the Fog of War?
- Bitcoin and XRP Price Outlook If the Senate Banking Committee Approves the CLARITY Act


