 Buy $GGs
Bitcoin, Polkadot and Tron Continue To Consolidate; Vital Trading Levels


Bitcoin has been slipping down the charts every time the bulls showed minor signs of recovery. At press time, Bitcoin was trading at $47,143.83 after trading above the $50k mark multiple times this month. The king-coin at the moment was consolidating between the price range of $47k and $50k. The bulls attempted to re-enter in the last 24 hours as Bitcoin increased 0.4% on its chart.
Bitcoin/USD Four-Hour Chart

Over the past six weeks, Bitcoin traded within a descending channel that followed this month. In the past 24 hours, the cryptocurrency tried to break upwards from the channel.
The increased bearish force has caused Bitcoin to struggle at the 23.6% Fibonacci level. Immediate resistance was at $50,173.04, and falling below the current level would cause it to trade near $41,063.97, which is almost 50% lesser than its ATH secured on November 10.
Buying strength post Bitcoin hitting its ATH was positive only a handful of times. However, despite consolidation, the Relative Strength Index was positive. This signals a possibility for the coin’s price to display northbound movement. The Directional Movement Index contrastingly hinted at a bearish outcome over the upcoming trading sessions.
DOT/USD Four-Hour Chart

Polkadot also continued to depict sideways trading with a slight appreciation of 0.7% over the last 24 hours. The coin was trading at $25.34 at press time. The altcoin was experiencing strong resistance at 23.6% Fibonacci level, acting as the coin’s immediate resistance mark. Long consolidation sessions have caused DOT to trade below the multi-month robust support line of $26. Buying strength of the coin displayed that the coin is yet to make a trend commitment.
The Relative Strength Index climbed up but was still below the half-line, suggesting that sellers dictated the coin’s price. In case of the buying strength recovers, there’s a possibility that DOT might recover from the lateral trading. Awesome Oscillator chose the bulls while MACD wasn’t too quick to flash the same readings.
TRX/USD Four-Hour Chart
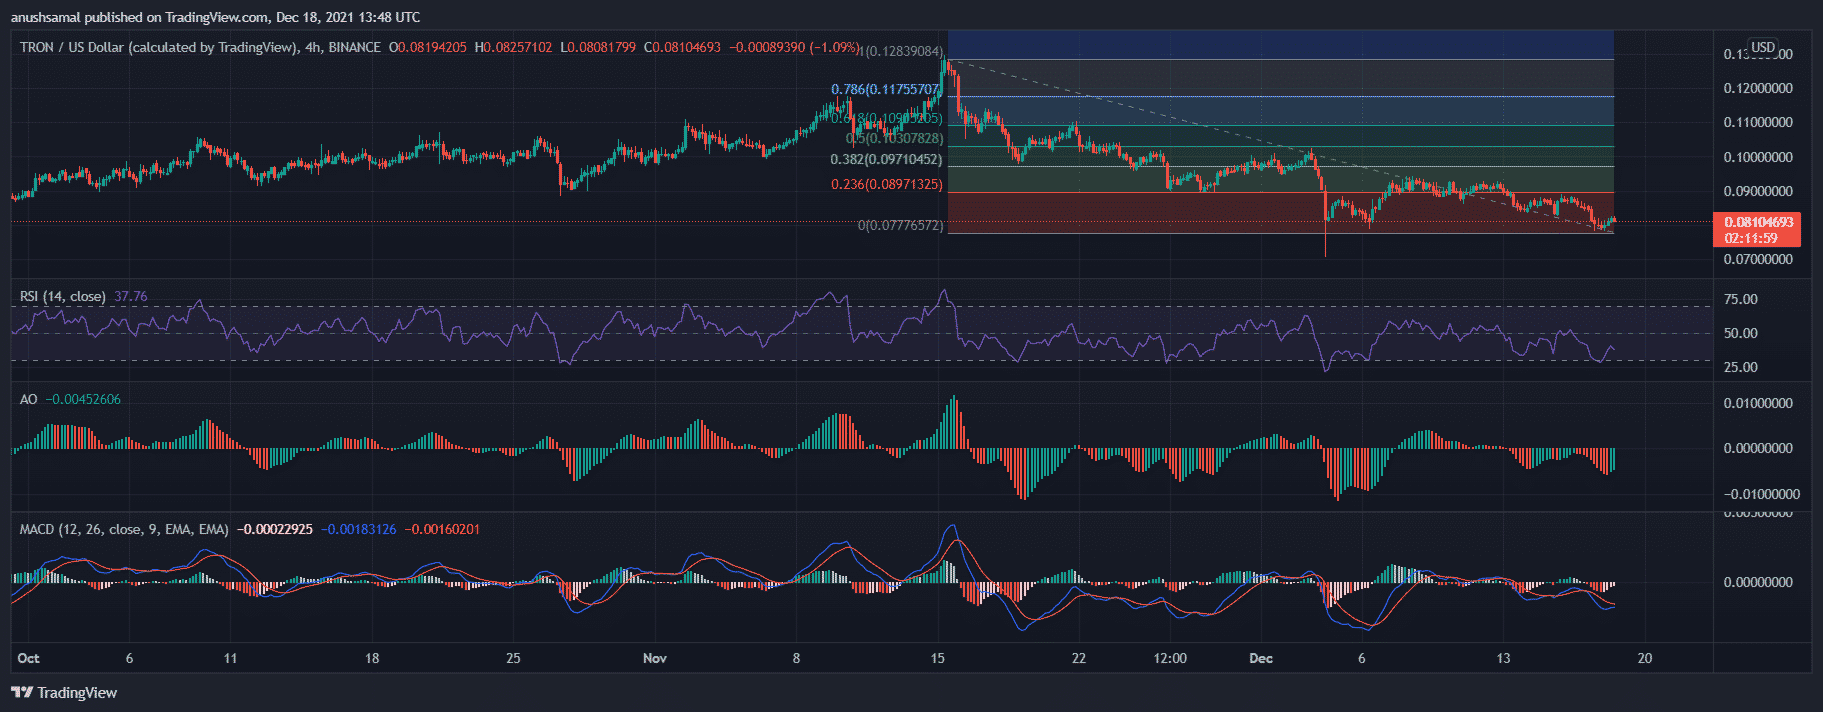
Tron’s prices remained sandwiched between $0.090 and $0.070, and at press time, it was trading for $0.081. It has been encountering a strong pullback from the 38.2% Fibonacci level. The immediate overhead price ceiling was $0.093, and the local support was $0.070.
The fear index has been super strong; hence, that is reflected in the number of buyers in the market. Tron’s current price action can also be tied to the news of Justin Sun retiring from the Tron Foundation.
The Relative Strength Index swayed with the bearish price movement as the indicator was below the half-line. Awesome, Oscillator chose the bulls, although declining green signal bars hinted that the bullish price action might fizzle out soon. MACD displayed bearish sentiments.
Play 10,000+ Casino Games at BC Game with Ease
- Instant Deposits And Withdrawals
- Crypto Casino And Sports Betting
- Exclusive Bonuses And Rewards


Why Trust CoinGape
CoinGape has covered the cryptocurrency industry since 2017, aiming to provide informative insights Read more… to our readers. Our journal analysts bring years of experience in market analysis and blockchain technology to ensure factual accuracy and balanced reporting. By following our Editorial Policy, our writers verify every source, fact-check each story, rely on reputable sources, and attribute quotes and media correctly. We also follow a rigorous Review Methodology when evaluating exchanges and tools. From emerging blockchain projects and coin launches to industry events and technical developments, we cover all facets of the digital asset space with unwavering commitment to timely, relevant information.

Delivered every day.
- Insights that move markets
- 100,000 active subscribers
Related Articles


- US-Iran War: Reports Confirm Bombings In UAE, Bahrain and Kuwait As Crypto Market Makes Recovery
- XRP Price Dips on US-Iran Conflict, But Capitulation Signals March Rebound
- Crypto Market at Risk as U.S.–Iran War Threatens Inflation With Oil Price Surge
- Polymarket U.S.–Iran Strike Bets Fuel Insider Trading Speculation as Crypto Traders Net $1.2M
- Cardano’s DeFi TVL Climbs as USDCx Stablecoin Launches on Network
- Circle (CRCL) Stock Price Prediction as Today is the CLARITY Act Deadline
- Analysts Predict Where XRP Price Could Close This Week – March 2026
- Top Analyst Predicts Pi Network Price Bottom, Flags Key Catalysts
- Will Ethereum Price Hold $1,900 Level After Five Weeks of $563M ETF Selling?
- Top 2 Price Predictions Ethereum and Solana Ahead of March 1 Clarity Act Stablecoin Deadline
- Pi Network Price Prediction Ahead of Protocol Upgrades Deadline on March 1


