 Buy $GGs
Bitcoin Price Analysis: BTC Drops 13% To Retest the $58,000 Support Floor


Bitcoin price retests the $58,000 support level as it struggles to reclaim the $60,000 crucial support wall. BTC has lost almost $10,000 from its all-time high above $69,000. Overcoming the 200 SMA above $62,000 could see Bitcoin restart the upswing.
Bitcoin price extends Tuesday’s price correction as it retests crucial support levels. Bitcoin has dropped as low as $58,527 on Wednesday as the $58,000 support level comes it handy. Analysts are, however, remain bullish on Bitcoin that it will resume the upswing as long as it recaptures the $60,000 psychological level.
Bitcoin Price Grapples With the $58,000 Psychological Level
The current BTC price drop has seen the big crypto decline 14% from the November 10 all-time high (ATH) above $69,000 to the current price around $59,572. The drop has seen Bitcoin slice through the $60,000 psychological level repeatedly shedding more than $10,000 from the ATH as seen on the four-hour chart.
The four-hour demand zone between the $58,527 and $60,876 levels offer crucial support areas that decide the direction taken by Bitcoin price.
A bounce from this support zone could bolster the bulls who are likely to push the Bitcoin price above the $60,876 major resistance level to tag the 200-period simple moving average (SMA) at $62,683. Flipping this level into support is likely to propel the bellwether cryptocurrency towards new record highs above $70,000.
BTC/USD Four-Hour Chart
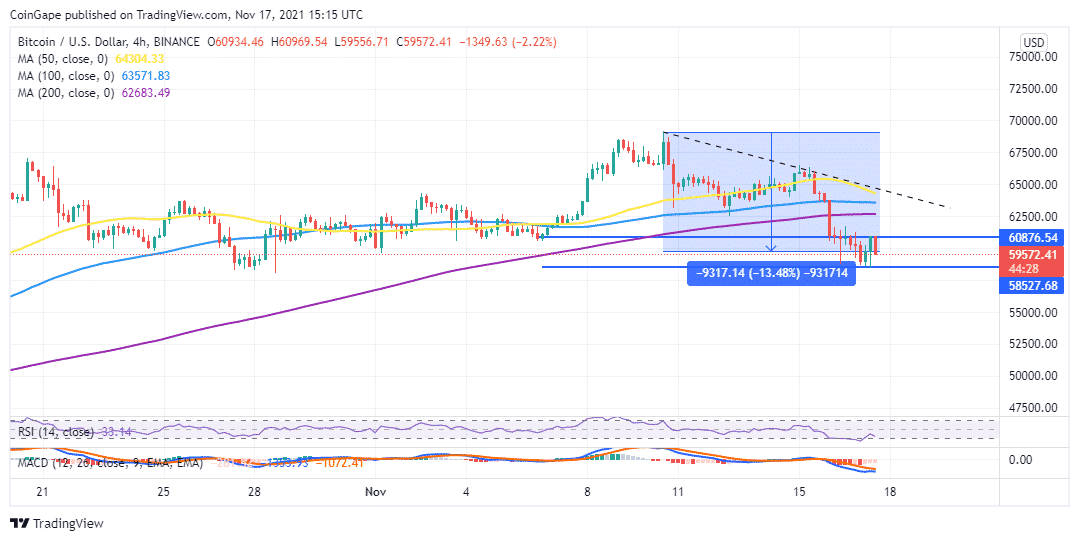
Before this, BTC/USD has to overcome the 100 SMA at $63,571 and 50 SMA at $64,304 embraced by the declining trendline.
The above bullish narrative thesis that BTC price will bounce hold the $58, 000 support zone, however, a breakdown of this support floor will suggest that Bitcoin could head into a liquidity area, ranging from $53,000 to $56,000 psychological levels.
The position of the Bitcoin price below the SMAs and the entry of the Relative Strength Index (RSI) into the oversold region validate this negative outlook.
The position of the Moving Average Convergence Divergence (MACD) indicator below the neutral line adds more credence to Bitcoin’s bearish narrative.
Play 10,000+ Casino Games at BC Game with Ease
- Instant Deposits And Withdrawals
- Crypto Casino And Sports Betting
- Exclusive Bonuses And Rewards


Why Trust CoinGape
CoinGape has covered the cryptocurrency industry since 2017, aiming to provide informative insights Read more… to our readers. Our journal analysts bring years of experience in market analysis and blockchain technology to ensure factual accuracy and balanced reporting. By following our Editorial Policy, our writers verify every source, fact-check each story, rely on reputable sources, and attribute quotes and media correctly. We also follow a rigorous Review Methodology when evaluating exchanges and tools. From emerging blockchain projects and coin launches to industry events and technical developments, we cover all facets of the digital asset space with unwavering commitment to timely, relevant information.

Delivered every day.
- Insights that move markets
- 100,000 active subscribers
Related Articles


- US-Iran War: Reports Confirm Bombings In UAE, Bahrain and Kuwait As Crypto Market Makes Recovery
- XRP Price Dips on US-Iran Conflict, But Capitulation Signals March Rebound
- Crypto Market at Risk as U.S.–Iran War Threatens Inflation With Oil Price Surge
- Polymarket U.S.–Iran Strike Bets Fuel Insider Trading Speculation as Crypto Traders Net $1.2M
- Cardano’s DeFi TVL Climbs as USDCx Stablecoin Launches on Network
- Top Analyst Predicts Pi Network Price Bottom, Flags Key Catalysts
- Will Ethereum Price Hold $1,900 Level After Five Weeks of $563M ETF Selling?
- Top 2 Price Predictions Ethereum and Solana Ahead of March 1 Clarity Act Stablecoin Deadline
- Pi Network Price Prediction Ahead of Protocol Upgrades Deadline on March 1
- XRP Price Outlook As Jane Street Lawsuit Sparks Shift in Morning Sell-Off Trend
- Dogecoin, Cardano, and Chainlink Price Prediction As Crypto Market Rebounds


