Bitcoin Price Analysis: BTC Down 11% To $60K But It Is Not Out


11% daily Bitcoin price losses are painful for ‘holders’ but no there is no need to panic as recent price action show that BTC is still bullish.
At the time of writing, Bitcoin price is trading at $60,882 approximately 11% down on the day with a market cap of $1.146 trillion also dropped 8% over the last 24 hours. The BTC bulls are fighting to keep the big crypto above the $60,000 immediate support as bears threaten to undo all the gains made in November.
Bitcoin Price Crash Is A healthy Correction, Do Not Panick!!
Bitcoin (BTC) has been largely bullish for the better part of 2021 hitting one all-time high (ATH) after another. A look at Bitcoin price action as displayed by the daily chart should leave BTC ‘holders’ unshaken. The todays Bitcoin crash of approximately 13% from the recent ATH above $69,000 is smaller compared to the declines seen in the recent past
YouTuber Lark Davis urges his over 460,000 subscribers not to panic as this is “just another Tuesday in the BTC” market as this dip is not as much as the 17% drop we in the September 07 flash crash. This crash even extended the losses to 25% taking BTC lows below $40,000 on September 21. What followed was an over 65% rally to a new ATH at $67,000 on October 20.
Even the 15% October 21 crash from this ATH to around $57,507 on October 28 as followed by another 22% rally to the latest ATH above $69,000 on November 10.
Therefore, there is no cause to worry as BTC remains bullish. Holding above the $60 support wall is crucial for the bulls who may focus on pushing the price above the $63,893 resistance level. After which, the move towards new price discoveries will the next logical move.
Plan B predicted BTC hitting $89K in November, and although that seems unlikely at the moment, I have a feeing we have not seen the top for BTC this year yet.
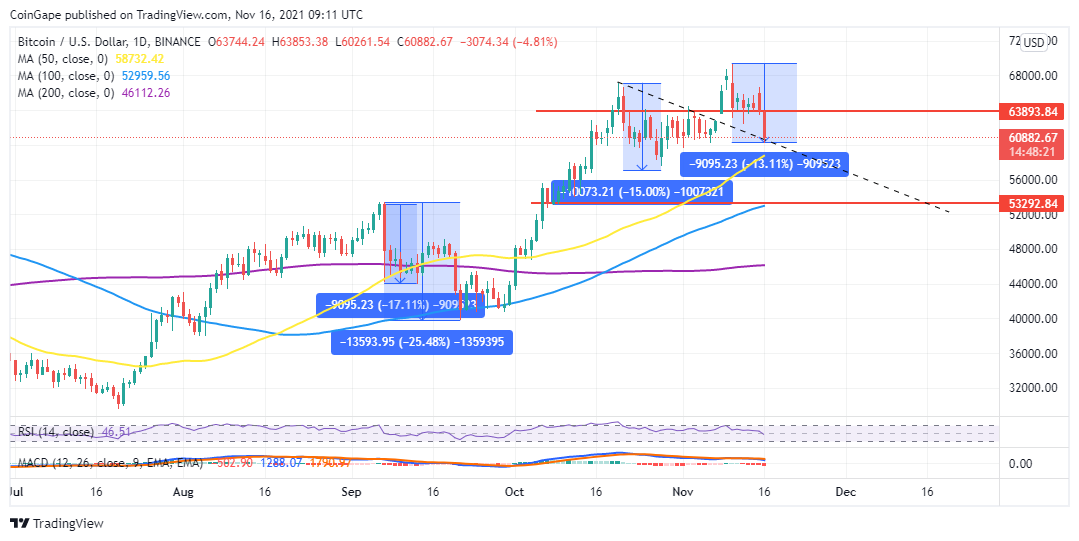
BTC/USD Daily Chart
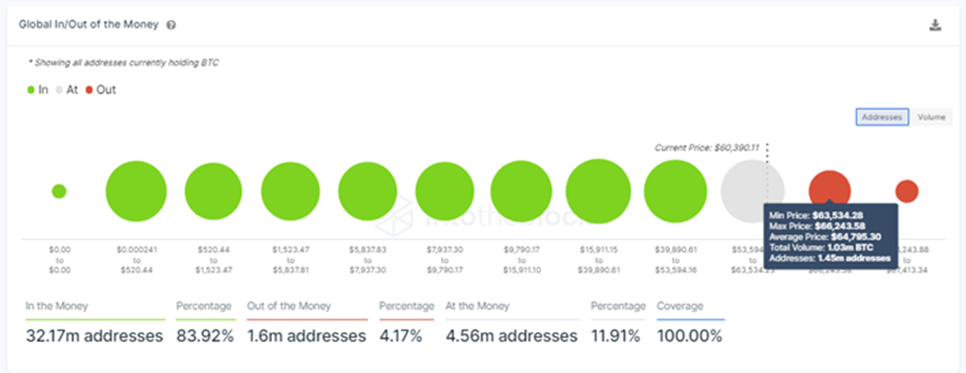
The position of the MACD above the zero-line point to a bullish market sentiment for BTC. Moreover, the Global In/Out Of The Money model by IOMAP shows that approximately 2 million addresses bought BTC between the current price above $60,000 ad the ATH above $69,000. These investors would not want to make losses which adds credence to Bitcoins bullish outlook.
Bitcoin IOMAP Chart
However, if the correction continues, we are likely to see a retest of the downtrend line which currently coincides with the BTC price around $60,882. If the price of the pioneer cryptocurrency slides below the trendline, it will drop to tag the 50-day Simple Moving Average (SMA) at $54,722 or the $53,292 support wall close to the 100-day SMA.
Why Trust CoinGape
CoinGape has covered the cryptocurrency industry since 2017, aiming to provide informative insights Read more… to our readers. Our journal analysts bring years of experience in market analysis and blockchain technology to ensure factual accuracy and balanced reporting. By following our Editorial Policy, our writers verify every source, fact-check each story, rely on reputable sources, and attribute quotes and media correctly. We also follow a rigorous Review Methodology when evaluating exchanges and tools. From emerging blockchain projects and coin launches to industry events and technical developments, we cover all facets of the digital asset space with unwavering commitment to timely, relevant information.


Delivered every day.
- Insights that move markets
- 100,000 active subscribers