Bitcoin Price Analysis: Rally Above $10,000 In Jeopardy, False Triangle Breakout Eyes $9,650

- Bitcoin price brief surge above $9,800 falls short of $9,900 on heating a wall at $9,850.
- BTC/USD is staring into a possible breakdown likely to test $9,650 and $9,450 respectively.
Bitcoin is exchanging hands at $9,751 following a rejection from levels above $9,800. Trading has been lethargic in the last seven days after Bitcoin fell head fast from levels above the critical $10,000 to $9,300. Recovery has been steady but not significant. Besides, the ongoing consolidation has forced most buyers to remain in the sidelines as they avoid the choppy markets.
Was the Triangle Breakout False?
Bitcoin surged briefly between the American session on Tuesday and the Asian session on Wednesday. The upward adjustment saw the bulls align for a breakout above the falling triangle pattern. However, the trend lost steam barely testing $9,850. At the time of writing, an ongoing retreat is holding ground above $9,750 (initial support). BTC/USD is dealing with increased selling activity that if not mitigated could pave the way for more losses towards $9,000.
According to the Relative Strength Index (RSI), Bitcoin price is inclined towards sustaining a bearish trend. Moreover, the trading volume appears to be rising, a factor that could push Bitcoin even lower.
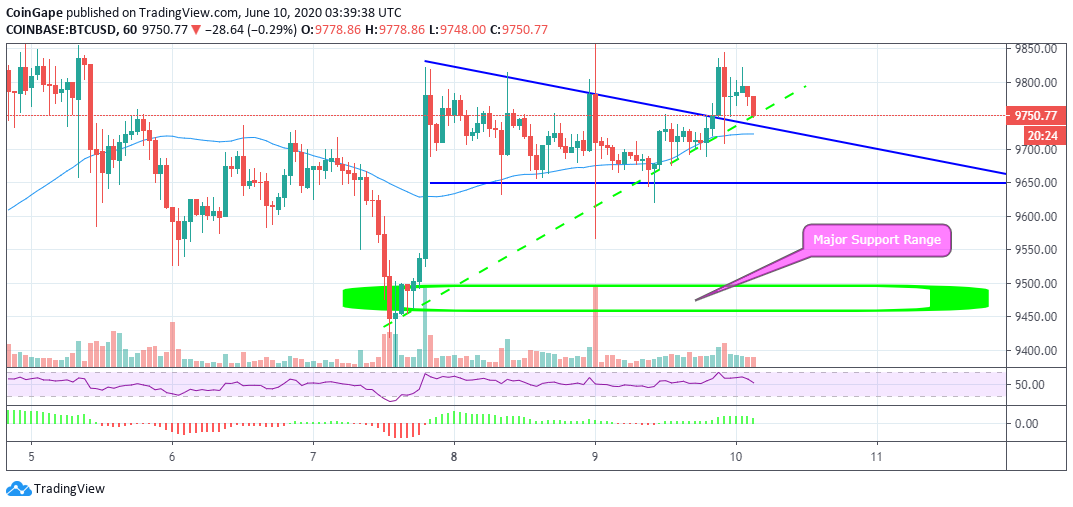
BTC/USD daily chart
Support is anticipated at the ascending trendline (broken green line), the 50 Simple Moving Average (SMA) in the 1-hour range, and at $9,700 (former resistance zone). The main support lies within a range spanning from $9,450 and $9,500. Note that Bitcoin dived to $9,300 last week, therefore, losses towards $9,000 are not out of the picture just yet. For now, the best the bulls can do is to hold onto the support at $9,750 and focus on breaking the key hurdles at $9,900 and $10,000.
Bitcoin Key Intraday Levels
Spot rate: $9,751
Relative change: -27
Percentage change: -0.28%
Trend: Bearish
Volume: Growing
Volatility: Low


- Ripple Partners DBS, Franklin Templeton To Launch Trading And Lending Backed by RLUSD
- XRP, SHIB, HBAR Among 15 to Get Faster Crypto ETF Approval Under SEC’s New Rule
- ‘Great Progress’: Cardano Founder Shares Update After CLARITY Act Roundtable
- Jerome Powell Signals No Rush to Cut Rates, Bitcoin Falls
- FOMC Meeting: Fed Makes First Rate Cut of the Year, Lowers Rates by 25 Bps
- Toshi Coin Gains 57% in One Day: What’s Driving the Sudden Upside?
- Shiba Inu Price Set to Soar as Exchange Reserves Dive Amid SHIB ETF Chatter
- Pepe Coin Price Prediction as Whale Moves $25M From Robinhood- Is a Breakout to $0.00002 Next?
- XRP Price Prediction as Market Longs Hit 78% amid VivoPower Treasury Expansion Launch — Is $4 Next?
- SHIB Price Forecast: Taker Buys Lead as Developers Counter Shibarium Exploit
- Solana Price Set for a 25% Jump as Open Interest Nears a $20 Billion Milestone


Why Trust CoinGape
CoinGape has covered the cryptocurrency industry since 2017, aiming to provide informative insights Read more…to our readers. Our journal analysts bring years of experience in market analysis and blockchain technology to ensure factual accuracy and balanced reporting. By following our Editorial Policy, our writers verify every source, fact-check each story, rely on reputable sources, and attribute quotes and media correctly. We also follow a rigorous Review Methodology when evaluating exchanges and tools. From emerging blockchain projects and coin launches to industry events and technical developments, we cover all facets of the digital asset space with unwavering commitment to timely, relevant information.
Premium Partners