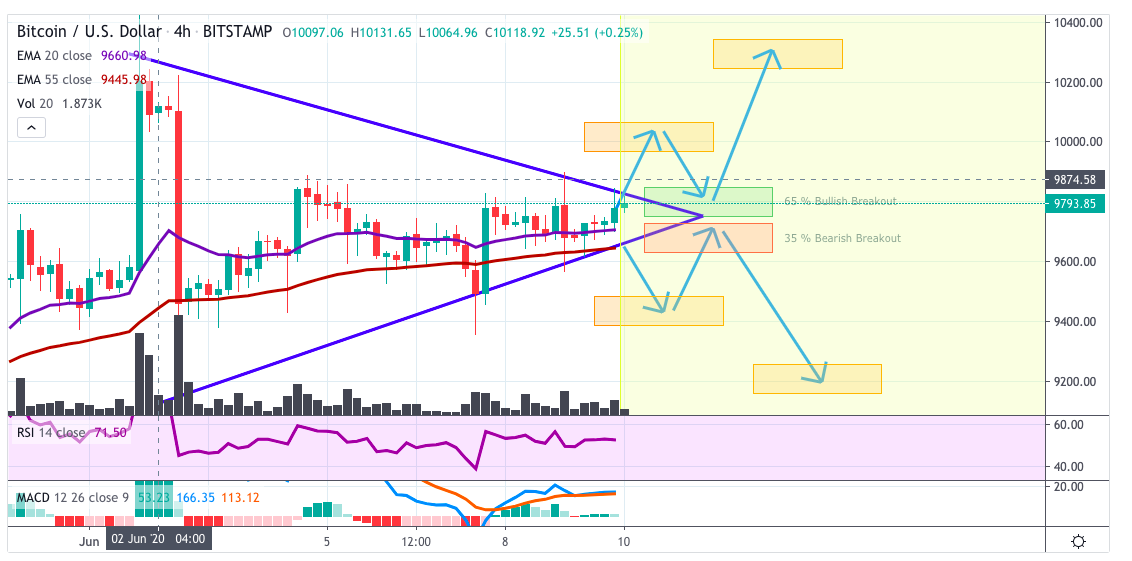
BTC Price Analysis: Bitcoin Preparing For A Heavy Breakout, Decisive Confirmation Above $9650 Incoming


- BTCUSD is moving in a symmetrical triangle that is at its high end currently
- The longer such a triangle consolidates the heavier the breakout will be.
BTCUSD is trading above the 20 and 55-EMA which gives the structure more bullishness than bearishness. This can firstly indicate a breakout to the upside as the trend consolidation is above the EMAs.
BTCUSD Price Analysis: 4 Hr BTC Chart
- PREVIOUS: 9783.00
- OPEN: 9786.64
- VOLUME: 5.634K
- DAY’S RANGE: 9566.81 — 9897.46
The volume is declining which is adding to the breakout scenario that will happen for BTCUSD. After the heavy breakout with its great volume BTCUSD has a falling volume which can indicate a price peak. The RSI consolidates in the middle and looks like it wants to aim for the lower and higher boundaries as its trending conditions. The MACD is in a moderate state with a breakout to the upside possible as the fast line crosses the slower.
Adding these signs all together we have a more bullish price-chart and triangle than a bearish one. The fact that BTCUSD is consolidating above the EMAs and has some bullish volatility gives the triangle a bullish shape.
When measured in probability we have a 65 % probability to breakout bullish and a 35 % probability to breakout bearish. It will be nice to see how this plays out in the bitcoins chart.
- TREND: Sideways
- EXPECTATION: Breakout
- PERCENTAGE EXPECTATION: 65 % Bullish , 35 % Bearish
Instant Currency Exchange at BestChange with Ease
- Compare Rates Across 1000+ Exchanges
- Access 250+ Cryptocurrencies & Pairs
- Save Time with Real-Time Price Tracking


Why Trust CoinGape
CoinGape has covered the cryptocurrency industry since 2017, aiming to provide informative insights Read more… to our readers. Our journal analysts bring years of experience in market analysis and blockchain technology to ensure factual accuracy and balanced reporting. By following our Editorial Policy, our writers verify every source, fact-check each story, rely on reputable sources, and attribute quotes and media correctly. We also follow a rigorous Review Methodology when evaluating exchanges and tools. From emerging blockchain projects and coin launches to industry events and technical developments, we cover all facets of the digital asset space with unwavering commitment to timely, relevant information.

Delivered every day.
- Insights that move markets
- 100,000 active subscribers