Bitcoin Price Prediction: BTC goes ballistic trading new record highs at $47,450, next target at $54,000


- Bitcoin spikes to $47,450 for the first time after closing the day above $40,000.
- The technical breakout eyes $53,620, suggesting that the top is nowhere near.
- BTC’s list resistance path is still on the upside as projected by the MACD.
Bitcoin resumed the uptrend on Monday after confirming support at $38,000. Closing the day above $40,000 also encouraged more buyers to join the market. The flagship cryptocurrency broke past the previous all-time high at $42,000, pushing the bullish leg above $45,000.
The rally was unstoppable towards $50,000 but Bitcoin stalled slightly above $47,000. At the time of writing, the bellwether cryptocurrency is trading at $45,780 after making a minor retreat from the new record highs at $47,450.
Short-term analysis on the 4-hour chart suggests that Bitcoin’s list resistance path is still upwards. For instance, the upward trend has been reinforced by the Moving Average Convergence Divergence (MACD). The technical indicator is moving higher above the midline at the same time the MACD line (blue) shows that Bitcoin is still in a buy zone.
BTC/USD 4-hour chart
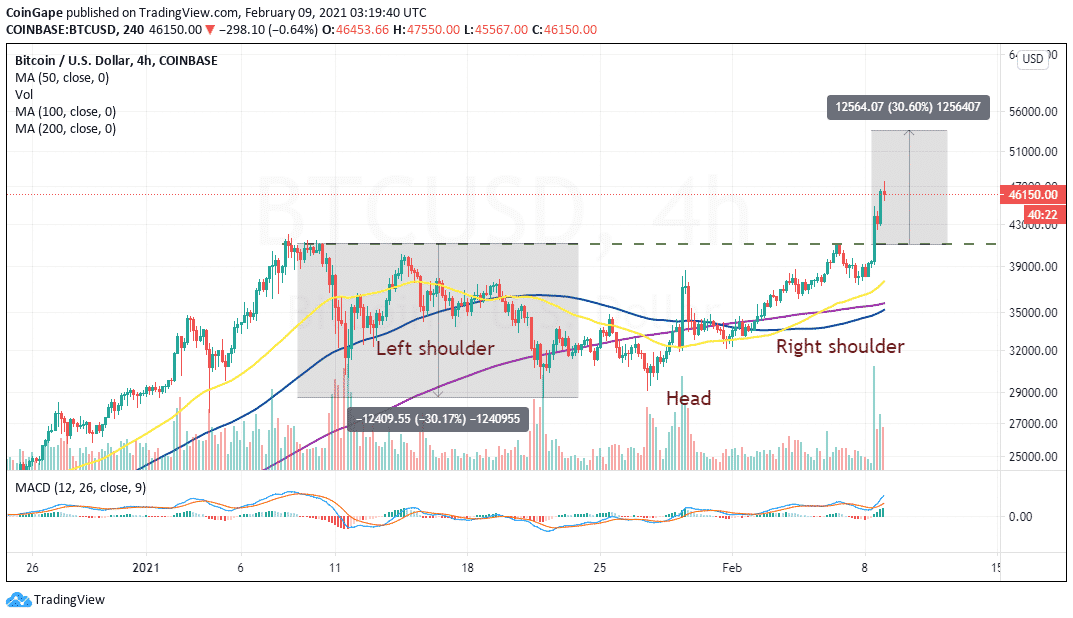
At the same time, an inverse head-and-shoulders pattern has formed on the same 4-hour chart. This pattern is bullish and currently suggests that Bitcoin has some distance to cover before hitting the target at $53,620.
Therefore, trading above $45,000 will be a bullish signal for investors to hold onto their bags while anticipating a breakout above $50,000. Moreover, it has been found that only 11% of the entire Bitcoin supply is available for trading. In other words, demand is currently high amid constricted supply. Thus, the pioneer cryptocurrency could continue to rally in the near term.
Note that, a correction will come into the picture if Bitcoin closes the day under $45,000. The trend reversal could go as far as $38,000 in search of formidable support. However, subtle buyer congestions at $43,000 and $40,000 will absorb the selling pressure, preventing a sharp price drop.
Bitcoin intraday levels
Spot rate: $46,175
Relative change: -290
Percentage change: -0.6%
Trend: Bearish
Volatility: High
Instant Currency Exchange at BestChange with Ease
- Compare Rates Across 1000+ Exchanges
- Access 250+ Cryptocurrencies & Pairs
- Save Time with Real-Time Price Tracking


Why Trust CoinGape
CoinGape has covered the cryptocurrency industry since 2017, aiming to provide informative insights Read more… to our readers. Our journal analysts bring years of experience in market analysis and blockchain technology to ensure factual accuracy and balanced reporting. By following our Editorial Policy, our writers verify every source, fact-check each story, rely on reputable sources, and attribute quotes and media correctly. We also follow a rigorous Review Methodology when evaluating exchanges and tools. From emerging blockchain projects and coin launches to industry events and technical developments, we cover all facets of the digital asset space with unwavering commitment to timely, relevant information.

Delivered every day.
- Insights that move markets
- 100,000 active subscribers