 Buy $GGs
Ethereum Price Hidden Bullish Agenda Reveals Rup-Up to $2,400


Ethereum price is leading the volatile stint in altcoins, trading 1.3% down to $1,837. The most prominent smart contracts token, with $222 billion of market capitalization and $6.8 billion in the 24-hour trading volume, briefly dipped below support at $1,830, touched lows of $1,825 before recovering to $1,835 at the time of writing on Thursday.
Ethereum Reveals 20% Inverse H&S Pattern Breakout
Ethereum price since mid-June is stuck in a narrow range, with movement on the upside barely touching $2,000, while the situation around the critical support at $1,800 seems to get dire for the bulls.
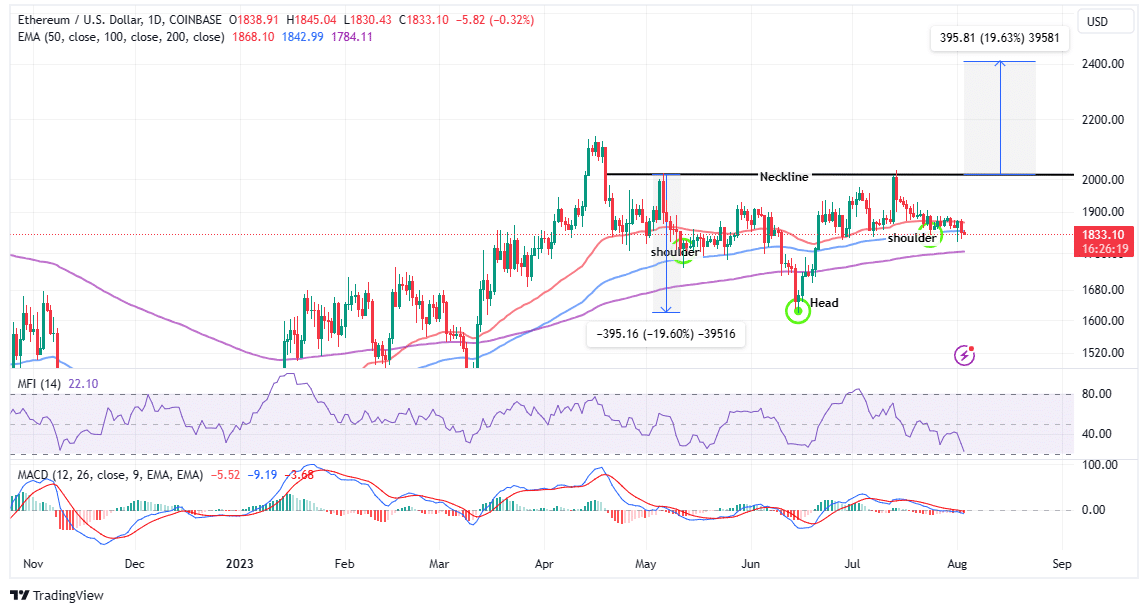
If a rebound above $1,900 does not follow swiftly, selling pressure will likely increase as more traders evaluate their positions. It is worth pointing out that Ethereum price is now trading below two crucial moving averages, starting with the 50-day EMA (red) and the 100-day EMA (blue).
Based on the prevailing technical picture tapping insights from other technical indicators such as the Relative Strength Index (RSI), which has since the beginning of July sustained a downtrend to the oversold region, and the sell signal from the Moving Average Convergence Divergence (MACD), a knee-jerk bullish reaction is highly unlikely.
That said, investors may want to start acclimatizing to Ethereum plunging below $1,800 and possibly revisiting support at the 200-day EMA (purple) at $1,785 before considering a trend reversal to $2,000.
If push comes to shove, declines may stretch to $1,600 allowing sidelined investors to get a lower-priced exposure to ETH, subsequently building the momentum for a larger trend reversal.
A deeper analysis of the daily chart reveals an inverse head and shoulders (H&S) pattern. It is a bullish reversal pattern that signals the end of a downtrend and the start of an uptrend.
The H&S consists of three troughs, with the middle one being the lowest and the other two being roughly equal in height. The pattern is confirmed when the price breaks above the neckline, which is a resistance level connecting the highs of the two shoulders at $2,000.
Traders should consider keenly following this pattern to identify a potential change in trend direction and enter long positions when the price confirms the breakout beyond the $2,000 level. The target price is usually calculated by adding the height of the pattern to the neckline, for instance, 19.30% to $2,412.
Propping Ethereum for a rally in the near future is the gradual increase in its DeFi total value locked (TVM), as shown by data from Coinglass. The value of all the crypto assets locked in Ethereum-based smart contracts has since mid-Jun has been rising following a longstanding downtrend from mid-April.
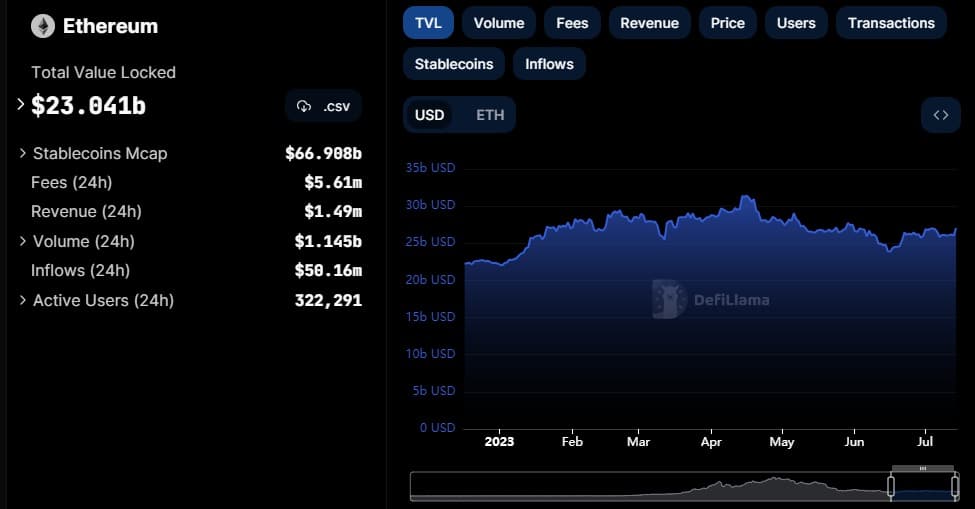
This increase in the TVL means Ethereum supply on exchanges is shrinking, thus reducing the potential selling pressure—and creating a suitable environment for a rally.
Related Articles
- New Backup Pool Solution: A Remedy For CRV Liquidation Crisis?
- Binance Announces Zero-Fee Bitcoin And Ethereum Trading, Bullish For Crypto Market?
- Australian Regulator ASIC Sues eToro for Offering High-Risk Derivative Products
Play 10,000+ Casino Games at BC Game with Ease
- Instant Deposits And Withdrawals
- Crypto Casino And Sports Betting
- Exclusive Bonuses And Rewards


Why Trust CoinGape
CoinGape has covered the cryptocurrency industry since 2017, aiming to provide informative insights Read more… to our readers. Our journal analysts bring years of experience in market analysis and blockchain technology to ensure factual accuracy and balanced reporting. By following our Editorial Policy, our writers verify every source, fact-check each story, rely on reputable sources, and attribute quotes and media correctly. We also follow a rigorous Review Methodology when evaluating exchanges and tools. From emerging blockchain projects and coin launches to industry events and technical developments, we cover all facets of the digital asset space with unwavering commitment to timely, relevant information.

Delivered every day.
- Insights that move markets
- 100,000 active subscribers
Related Articles


- ZachXBT Names Axiom Exchange in Alleged Employee Crypto Insider Trading Investigation
- Bitcoin Falls as U.S. Jobless Claims Signal Labor Market Rebound
- Bitcoin News: CitiBank to Launch BTC Services in 2026
- Deutsche Bank-Backed AllUnity Launches First MiCA-Compliant Swiss Franc Stablecoin
- Crypto Market on Edge as US-Iran Hold Talks Ahead of Trump’s War Deadline
- Pi Network Price Prediction Ahead of Protocol Upgrades Deadline on March 1
- XRP Price Outlook As Jane Street Lawsuit Sparks Shift in Morning Sell-Off Trend
- Dogecoin, Cardano, and Chainlink Price Prediction As Crypto Market Rebounds
- Will Solana Price Rally to $100 If Bitcoin Reclaims $72K?
- XRP Price Eye $2 Rebound as On-Chain Data Signals Massive Whale Accumulation
- Ethereum Price Reclaims $2K- New Rally Ahead or a Temporary Bounce?


