The symmetrical triangle pattern is a continuation pattern that accelerates the prevailing trend movement. The price action makes subsequent narrow peaks and troughs(refer example below), which can be connected using two converging trendlines. The chart may show a triangle-like structure, gradually squeezing the price as it advances towards the apex.
This triangle pattern usually provides a short break period after a drastic move. Thus, the consolidation within this symmetrical triangle pattern allows the prices to stabilize before it resume the original trend.
The symmetrical triangle is a chart pattern that shows a neutral phase in the market. It forms when two lines, representing higher lows and lower highs, converge. As these lines come closer, there’s a higher chance of a significant breakout.
At the beginning, the triangle is widest, indicating a consolidation of energy as prices move sideways. This phase often precedes a strong breakout or breakdown with increased volume, as traders wait for the market to decide its direction.
While the symmetrical triangle is neutral, breakouts tend to follow the overall trend. If it forms after an uptrend, a bullish breakout is more likely; if after a downtrend, a bearish breakout is anticipated.

So, we can distinguish between a bullish symmetrical triangle (formed after an uptrend) and a bearish one (formed after a downtrend). These are considered continuation patterns, representing a temporary pause within the overall trend.
Finding a perfectly symmetrical triangle is challenging as one trend line usually leans more than the other.
The formation of a symmetrical triangle pattern in the stock market is about a period of consolidation before a price breakdown. It predicts the market sentiments and gives cues on the – share price. It indicates that the market is unprepared to predict the future price trends for the stock in question.
Following a systematic approach when trading in symmetrical triangle patterns can help traders make wiser investment decisions. Considering the points mentioned below can lower the risk and maximise the gains.
A symmetrical triangle pattern indicates significant price movement in the market. The prices can move in either direction: upward and downward. Holding a long position when the price trends move upwards and a short position during a downward price trend will give maximum profits.
Paying attention to the volume of transactions in the stock market is crucial when the price breaks out of the triangle pattern. If a breakout happens with a high-volume transaction, it is a strong signal to make the most out of your investments.
Estimating the exact prices for the shares is difficult but possible by measuring the height of the triangle and projecting the direction of the breakout.
Using this risk management tool can help you mitigate the risk that occurs due to the unpredicted price movements in the stock market. Stop-loss order automatically sells a security when it reaches a set price target. Placing it just beyond the opposite side of the triangle pattern can protect traders from false breakouts.
Every trader has a trading strategy that they stick to. Symmetrical triangle patterns occur at different timeframes and choosing the one closer to your timeframe will give you the best investment results.
To find a symmetrical triangle pattern on the chart, looking at the two converging trend lines will help. The trend lines should converge at the same slope, forming a triangle. To draw a symmetrical triangle on a live chart start by connecting:
1. At least two swing highs with an upper trendline
2. Two swing lows with a lower trendline
3. Connecting the two lines at a common point called the apex
The symmetrical triangle pattern can last for a few weeks to a few months. However, if the pattern lasts less than 3 weeks, it is called a pennant which is a continuation pattern.
Example of the symmetrical triangle pattern
In the recent past, Bharti Airtel Limited and Maruti Suzuki India Limited witnessed a symmetrical triangle pattern in the year 2020 and 2019 respectively.
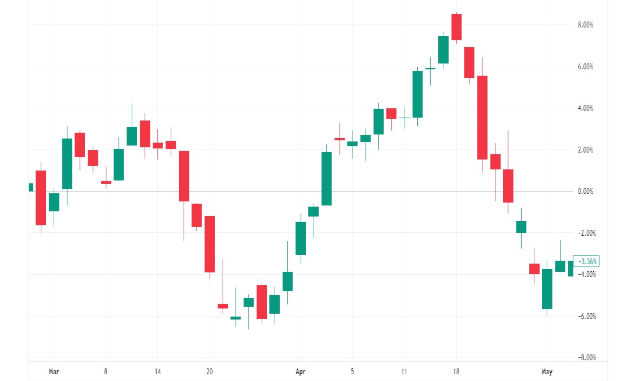
Maruti Suzuki India Limited Symmetrical Triangle Pattern
This leading automobile manufacturer in India witnessed a symmetrical triangle pattern in 2019 leading to a significant movement in their share prices. It created a bullish pattern in the market and the stock prices continued to rise.
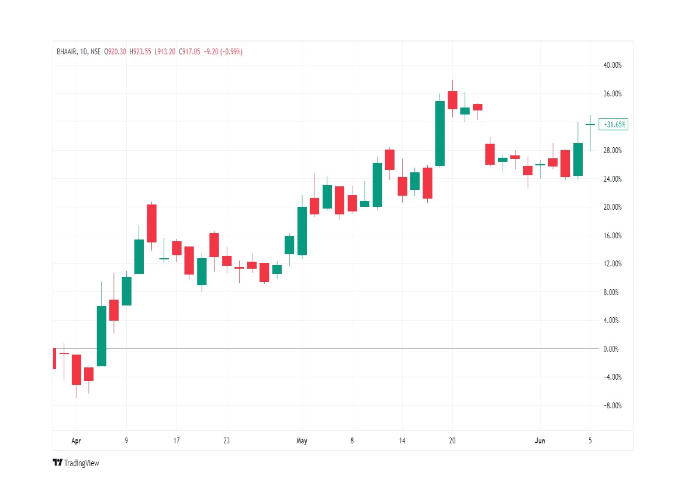
Bharti Airtel Limited Symmetrical Triangle Pattern
One of the leading telecommunication brands in India witnessed price fluctuations and a symmetrical triangle pattern in 2020. The breakout of the pattern formed between April and June 2020 created a bearish trend. As a result, the stock prices went down and continued their downward trajectory.
The price action narrowing within the converging trendline will eventually breakout. Thus, a candle closing beyond these trendlines will give an entry signal and encourage a directional rally on the respective side.
Note- even though this pattern is more likely to continue its prior trend, the price may breach the other end of the pattern if the market sentiment favor it. Thus, we must wait for the actual breakout before entering the market.
As per the technical setup, the target level of this pattern is calculated by measuring the distance between the initial high and low of the triangle. Thus, the traders can capture those same points launched from the breakout mark.
Note- traders can use this method to predict the potential move and book target nearby at some important chart level.
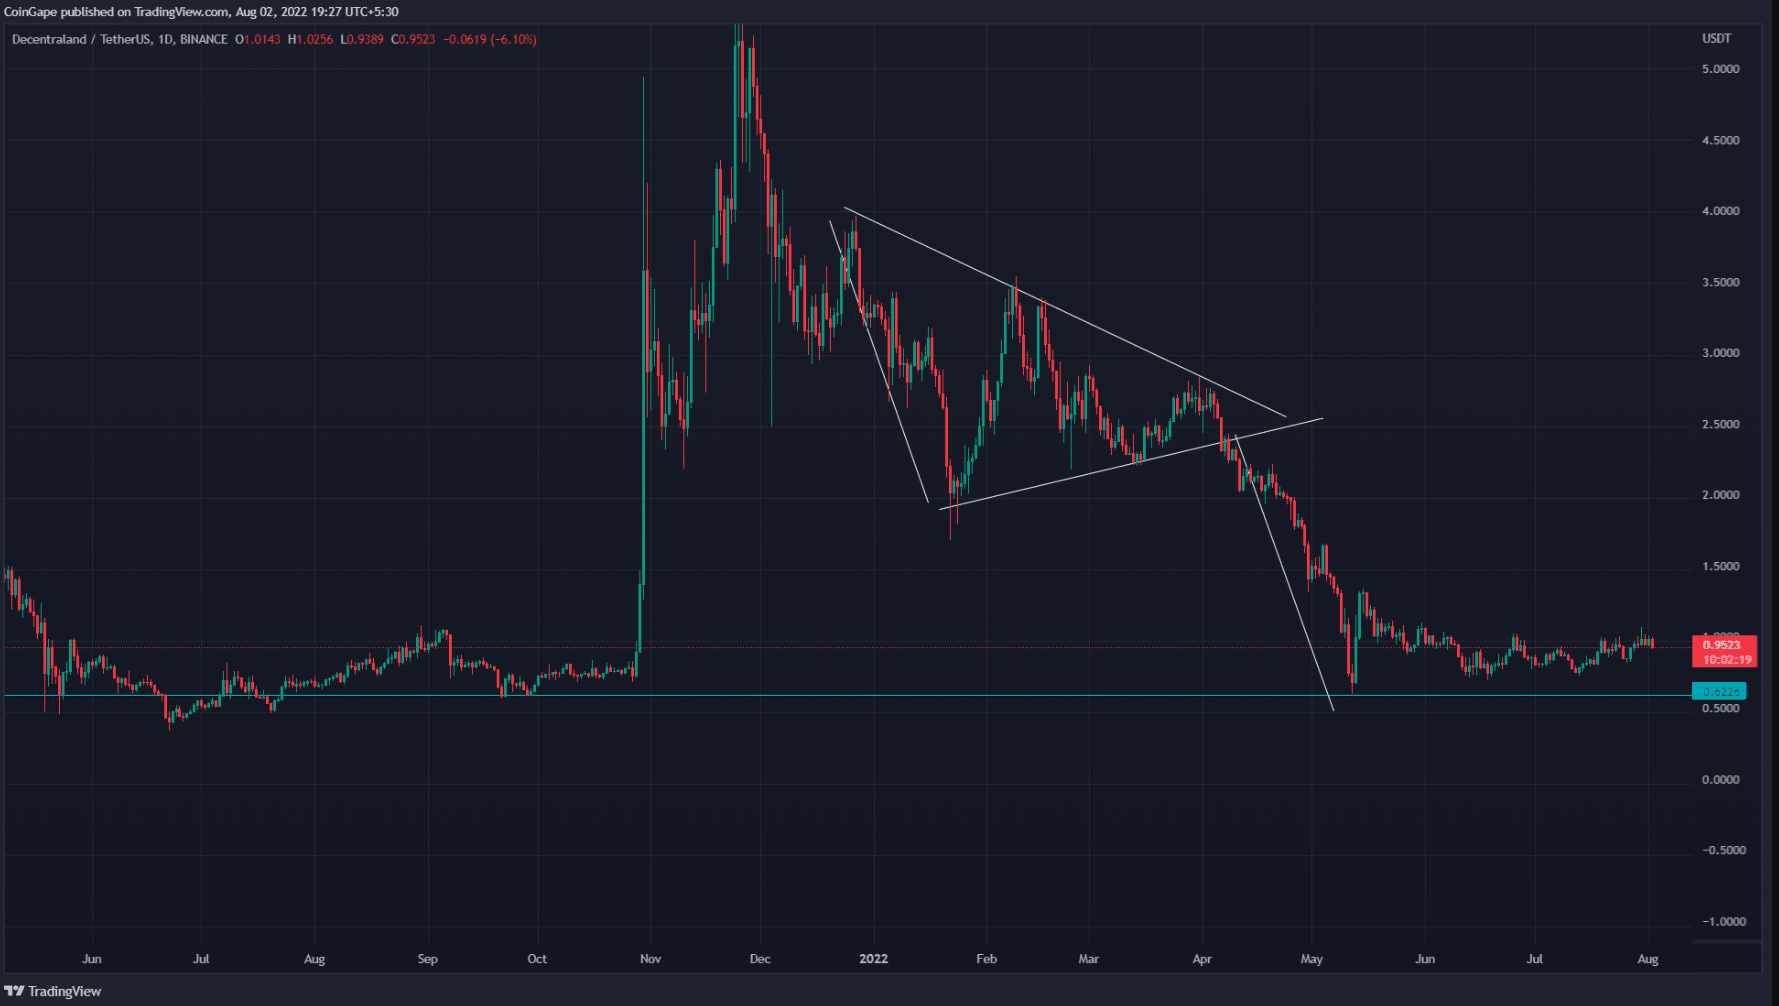
Examples: the MANA/USDT pair resonated within a symmetrical triangle pattern from December end(2021) to early April(2022). Thus, on June 6th, the coin price breached the support trendline and tumbled 73.63% lower to $0.06(September 2021 low).
The difference between a symmetrical triangle and a wedge:
| Points of Difference | Symmetrical Triangle | Wedge |
| Formation | Formed by two intersecting trend lines connecting successive highs & lows | Formed by the intersection of trend lines on the price chart. |
| Pattern | Neutral. Can be interpreted as a continuation or reversal pattern | Generally considered as reversal set-ups. |
A symmetrical triangle pattern indicates a consolidation period before the price breaks down in the stock market. It can start either a bullish or bearish trend in the stock market. However, analysing this pattern becomes easier with the help of risk management tools.
1. What is a symmetrical triangle chart pattern, and how does it form?
A symmetrical triangle chart pattern is a technical analysis pattern. Traders make the triangle chart pattern by joining a series of peaks and troughs on a chart of a stock or a cryptocurrency using digital tools for analysing candles and other patterns. For a cryptocurrency or stock, the pattern typically indicates that consolidation could follow before a potential breakout or breakdown can come in the future.
2: How can traders use symmetrical triangles to make informed decisions?
Symmetrical triangles can be used to predict the price movements of a cryptocurrency or a stock. A breakout above the upper trendline is analysed that a bullish trend could arrive in the coming times for the cryptocurrency or stock. On the other hand, a breakdown below the lower trendline might indicate a bearish trend as per the symmetrical triangle chart pattern.
3: What is the significance of the symmetrical triangle’s duration?
The duration of a symmetrical triangle could predict the upcoming price movement. Long durations suggest a stronger breakout. Traders monitor the pattern closely to predict the movement of a stock or cryptocurrency.
4: Can symmetrical triangles occur in any market or timeframe?
Yes, symmetrical triangles can occur in various markets. Some of the markets in which traders use symmetrical triangles include crypto, stocks, forex and commodities.
5: Are there any potential risks or limitations associated with relying on symmetrical triangles?
It’s essential to be aware of potential false signals. Breakouts or breakdowns may not always follow the expected direction.
Share on


 50k+ Articles