Alert XRP Holders; XRP Price Approaching Major Technical Confluence


The XRP/USDT pair has gained 50% since last week. The seven consecutive green candles in the technical chart indicate strong bullish momentum. However, the bears maintaining stiff resistance at the $1 mark will confirm if buyers are ready for a bullish rally.
Key technical points
- The XRP buyers trying to retake 20-and-50 weekly EMA
- The weekly-RSI chart entering the bullish territory
- The intraday trading volume in the XRP is $6 Billion, indicating a 105% gain.
 Source- Tradingview
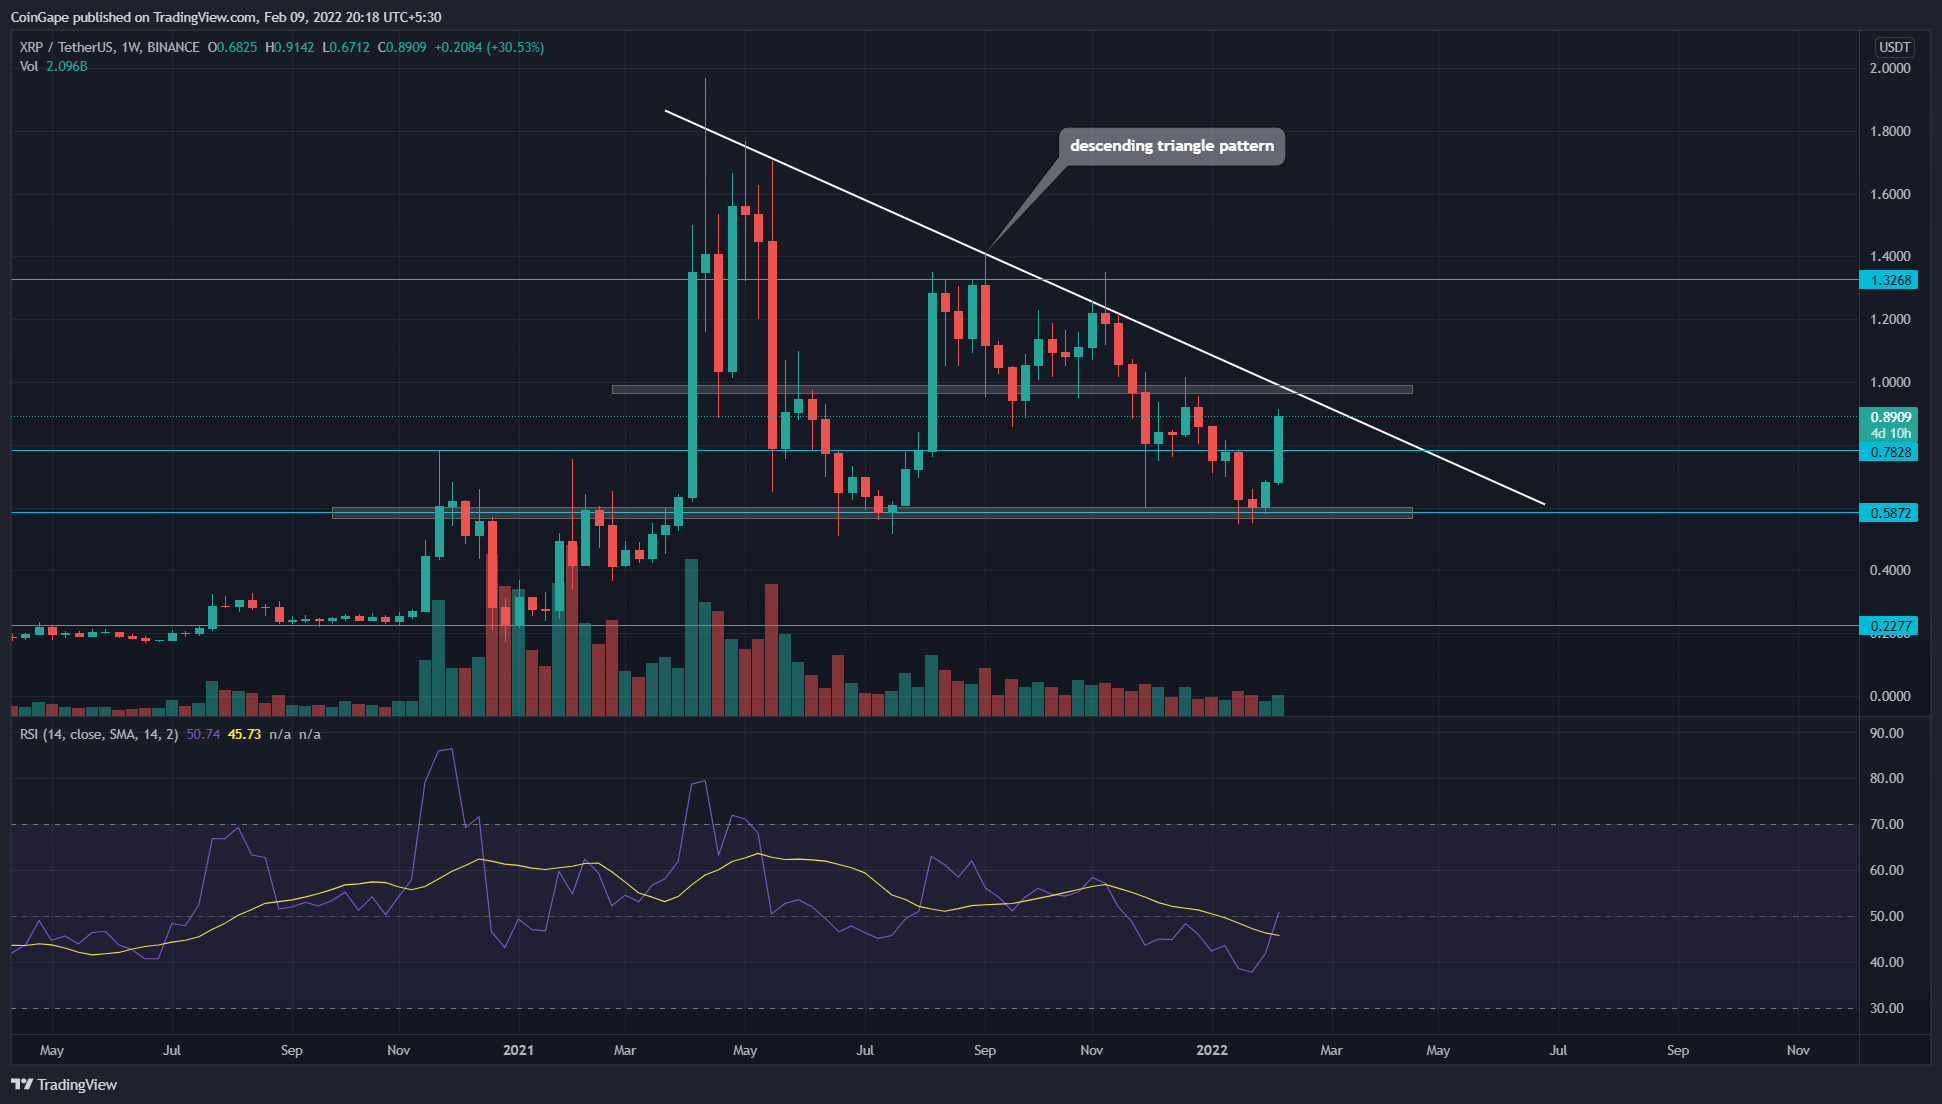
On February 4th, the XRP price rebounded from the yearly support of $0.6, with a weekly-morning star candle pattern. XRP vs SEC case approaching closure has helped to bolster the upcoming rally and breached the $0.8 resistance.
XRP price gradually continued to move up and is currently trading at the $0.88 mark. Furthermore, the XRP technical chart shows a descending triangle pattern, and the coin price is nearing the confluence resistance of the pattern’s resistance trendline and $1 psychological level.
If XRP price respects this chart pattern, the sellers would reject the coin from the $1 mark and slide it back to $0.6 support.
However, the recent price jump has surged the weekly Relative strength index(50) above the 14-SMA line and is currently knocking on the midline door.
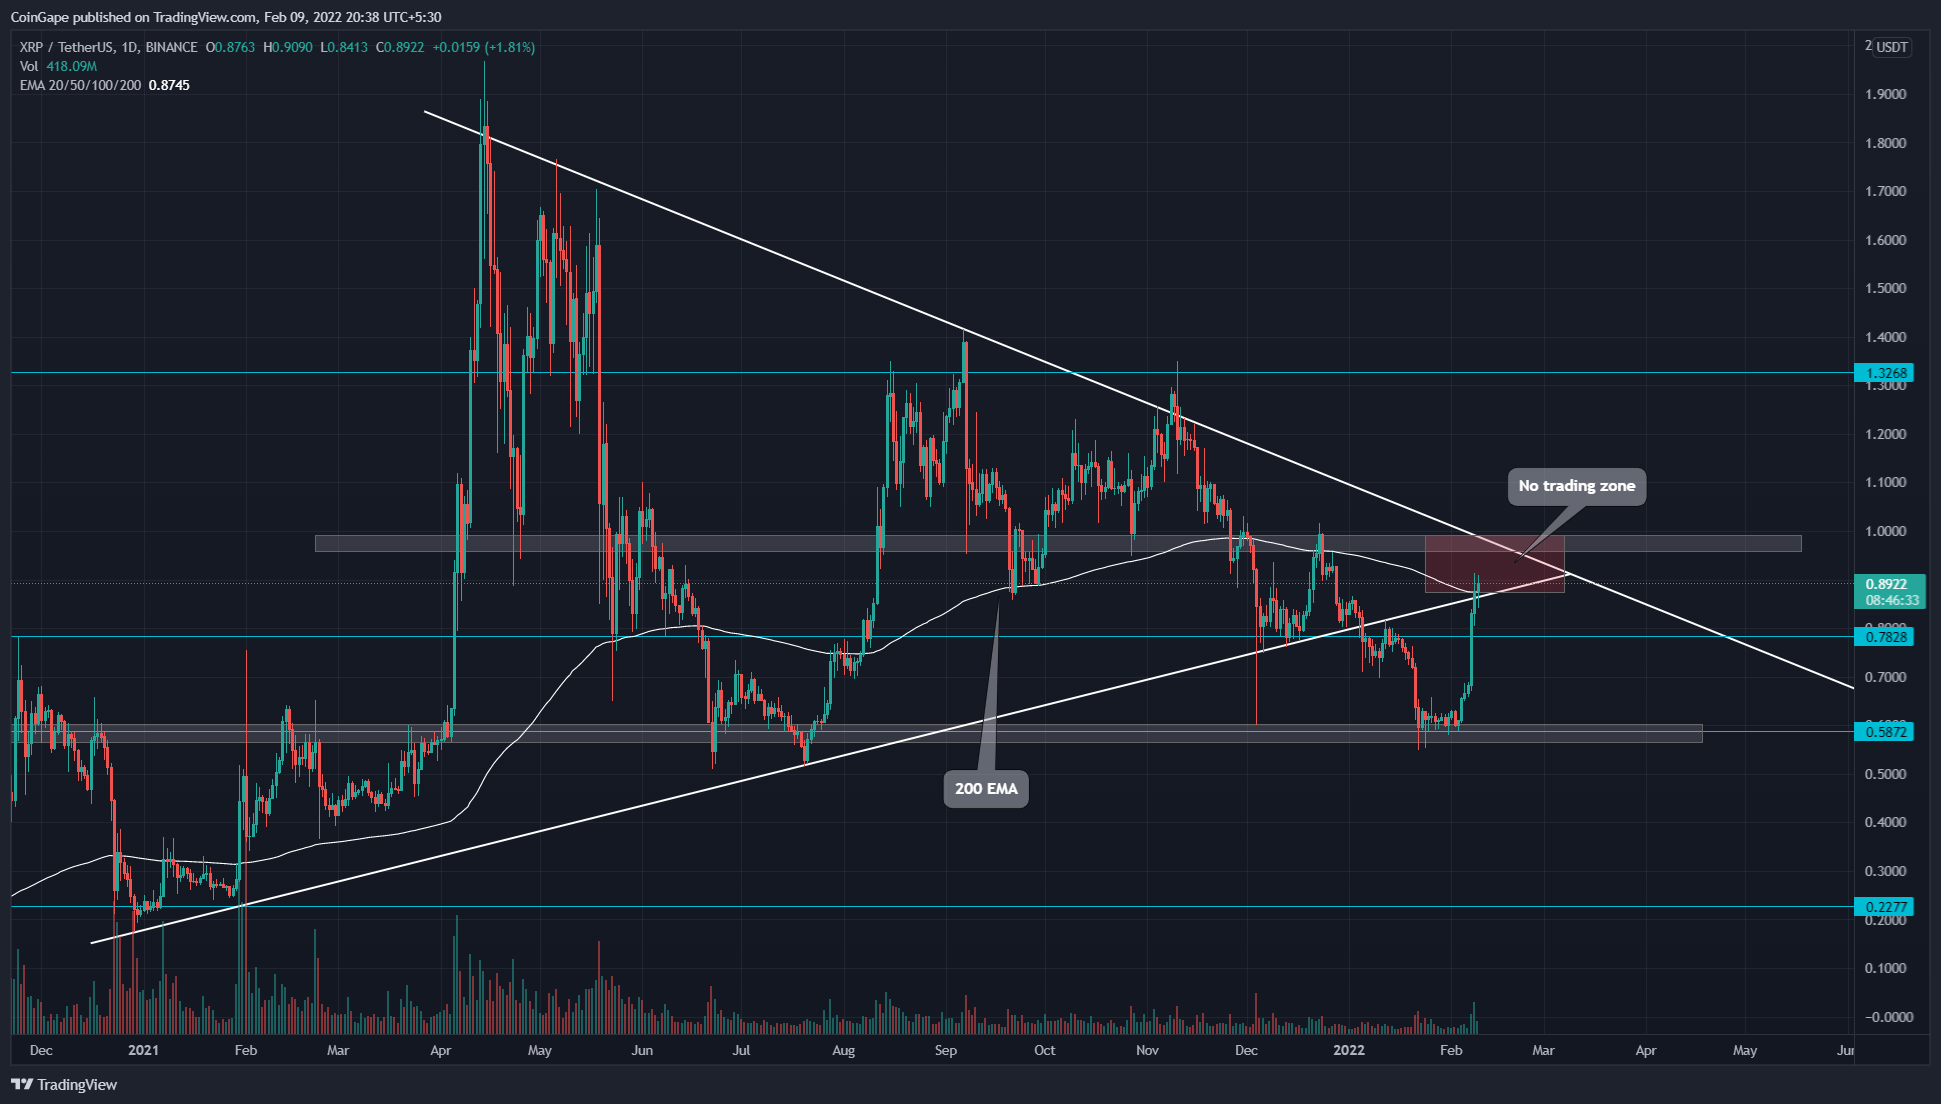
XRP Bulls Plunge Above The Resistance Trendline
 Source- Tradingview
Even though the XRP price is under the influence of a major bearish pattern, the recent price action accentuates the bull power. As highlighted in the recent tweet by Cryptoes, the altcoin price provided a daily-candle closing above the shared resistance of a long coming trendline and 200-day EMA.
Therefore, the price range between the $1 and 200 EMA can be considered a no-trading zone. A smart trader would avoid the conflict between these crucial technical levels and wait for a confirmation for one party overpowering the other.
A decisive breakout and closing beyond the mentioned levels should signal the entry opportunity with the following trend.
- Resistance levels- $1 and $1.32
- Support levels- 200-day EMA, $0.786

Why Trust CoinGape
CoinGape has covered the cryptocurrency industry since 2017, aiming to provide informative insights Read more…to our readers. Our journal analysts bring years of experience in market analysis and blockchain technology to ensure factual accuracy and balanced reporting. By following our Editorial Policy, our writers verify every source, fact-check each story, rely on reputable sources, and attribute quotes and media correctly. We also follow a rigorous Review Methodology when evaluating exchanges and tools. From emerging blockchain projects and coin launches to industry events and technical developments, we cover all facets of the digital asset space with unwavering commitment to timely, relevant information.

Related Articles


- Crypto Traders Bet on Bitcoin Price Hitting $100K Before Month-End as BTC Breaks $97k
- Arthur Hayes Predicts BTC Price to Surge in 2026 Amid Dollar Liquidity Expansion
- Ethereum Staking Hits Record Highs as BitMine Continues to Stake ETH
- CLARITY Act Stalls as Senate Postpones Thursday’s Markup Amid Coinbase Backlash
- U.S. SEC Ends Zcash Foundation Probe as Dubai Tightens Rules on Privacy Tokens
- Dogecoin Price Forms an Inverse Head and Shoulders: Will DOGE Target $0.18 Next?
- Bitcoin Price Forecast: How the Supreme Court Tariff Decision Could Affect BTC Price
- Ethereum Price Prediction as Network Activity Hits ATH Ahead of CLARITY Markup
- Robinhood Stock Price Prediction: What’s Potential for HOOD in 2026??
- Cardano Price Prediction as Germany’s DZ Bank Gets MiCAR Approval for Cardano Trading
- Meme Coins Price Prediction: What’s Next for Pepe Coin, Dogecoin, and Shiba Inu Amid Market Rally?


