Apecoin Price Breaks $5.7 Barrier For A 14% Rally, But What Next?
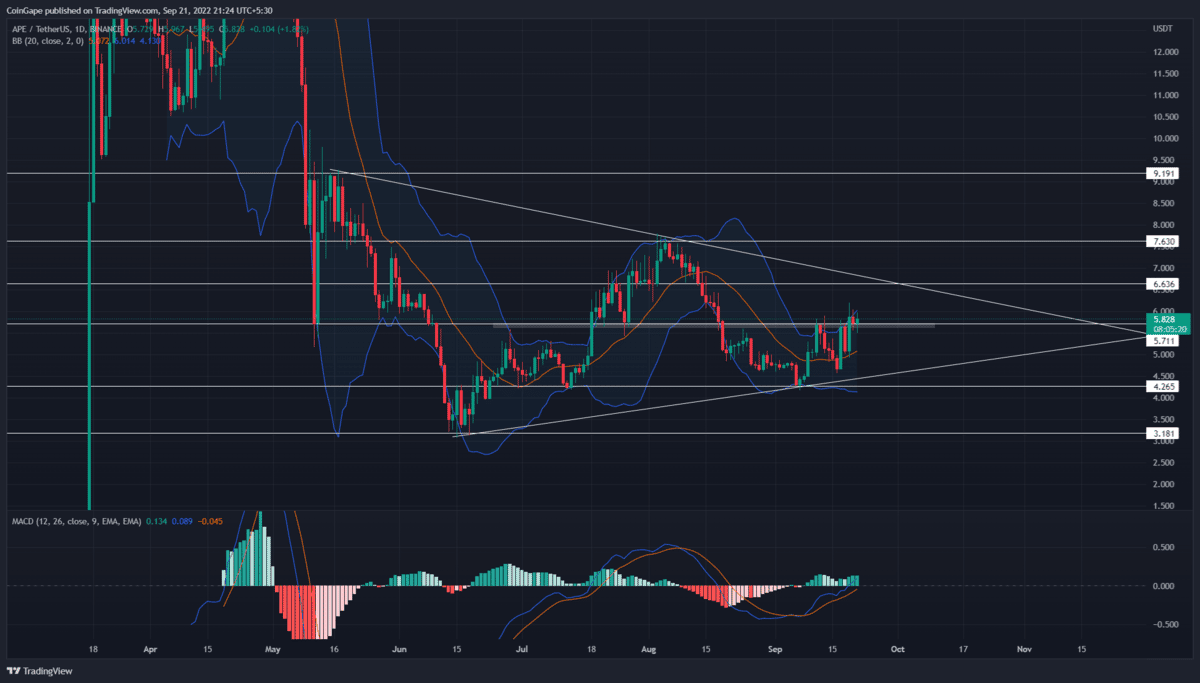
Following the May-June downtrend, the Apecoin price started walking a lateral path. Moreover, the altcoin resonating within two converging trendlines indicated the formation of an inverted pennant pattern. This symmetrical triangle-type consolidation shows a short break period for coin sellers before they continue the prevailing downtrend.
Key points from Apecoin price analysis:
- The APE price wobbling within a symmetrical triangle pattern will soon enter a no-trading zone
- The 20 and 50 EMA closing a bullish crossover in the daily timeframe chart
- The intraday trading volume in Apecoin is $385.2 Million, indicating a 36% loss
The ongoing bull cycle within this pattern was initiated when the prices rebounded from the support trendline on September 7th. However, after two weeks of struggles, the buyers have recently managed to breach the $5.6-$5.7 supply zone.
The coin chart showed two days of the retest phase in which the lower price rejection candle indicates a great entry opportunity. Thus, this flip support could increase the bullish momentum and drive the Apecoin price 14% higher to the shared resistance of $6.6 and a resistance trendline
Also read: Just-In: ApeCoin (APE) Community Gets Its Separate BAYC NFT Marketplace
Under the pattern’s influence, the Apecoin price will likely revert from the resistance trendline and make its way to the support trendline.
As per technical setup, a breakdown below the support trendline will trigger the inverted pennant pattern. Doing so will resume the prevailing downtrend, and at first, the potential downfall will drop to the June bottom support of $3.18.
On a contrary note, a triangle consolidation holds a possibility to breach the overhead trendline. If this theory worked out, the coin holders might witness a new recovery rally.
Technical Indicator
MACD indicator: with a significant gap, the fast and slow lines may soon enter bullish territory, boosting the buyer’s conscience in this recovery.
Bollinger band indicator: the coin price retesting the indicator’s upper band could stall the ongoing recovery or cause a minor retracement. However, until the prices sustain above the support trendline, the coin holder doesn’t have to panic.
- Resistance levels: $6.6 and $7.6
- Support levels: $5.7 and $5.1
Recent Posts
- Price Analysis
Bitcoin Price on Edge as $24B Options Expire on Boxing Day — Is $80K About to Crack?
Bitcoin enters the final stretch of the year with the price behavior signaling a decisive…
- Price Analysis
Crypto Market Rebounds: Are Bulls Positioning for a Santa Rally?
The crypto market showed signs of recovery on Christmas Day, gaining 0.67% in the…
- Price Analysis
XRP, Bitcoin, Ethereum Price Predictions Ahead of Jan 2026 CLARITY Act and US Crypto Reserve Plans
The XRP, Bitcoin, and Ethereum prices remained in a bear market after falling by over…
- Price Analysis
Pi Network Analysis: Pi Coin Price Surges on Christmas Eve, Can It Hit Year-End Highs?
Pi coin price reflect cautious positioning as market structure tightens near a key base. The…
- Price Analysis
Why Dec 26th Is A Do Or Die for Bitcoin Price Ahead Of Record Options Expiry?
As Christmas winds down, the Bitcoin price dipped 0.74% to around $86,750. Market participants…
- Price Analysis
Why Bitcoin, Ethereum And XRP Prices Are Down Today? (24 Dec)
The crypto market extended losses ahead of Christmas as Bitcoin, Ethereum, and XRP slipped further…