Bitcoin Crosses $22k; Is Time To Accumulate?


Bitcoin price analysis remained bullish for the day. The price is trading in the green for the past few hours. However, the bulls took a breather near the higher levels. In the previous session, the price zoomed to see the base for the extension of the gains. The continuation of the upside momentum needs additional buying participation. As of press time, BTC/USD is trading at $22,265, up 2.09%.
- Bitcoin price consolidates near higher levels waiting for more bullish confirmation.
- A decisive close above $22,500 would strengthen the upside outlook.
- This downside risk remains limited, however, the crucial support is around $21,500.
The broader crypto market offers no surprises and the gains at the beginning of the week were no exception. Bullish sentiment is dominant, and the cryptocurrency seemed to be days away from the lower low. However, a significant price change in the change of macro picture could change the view from a technical aspect.
Bitcoin price turns north
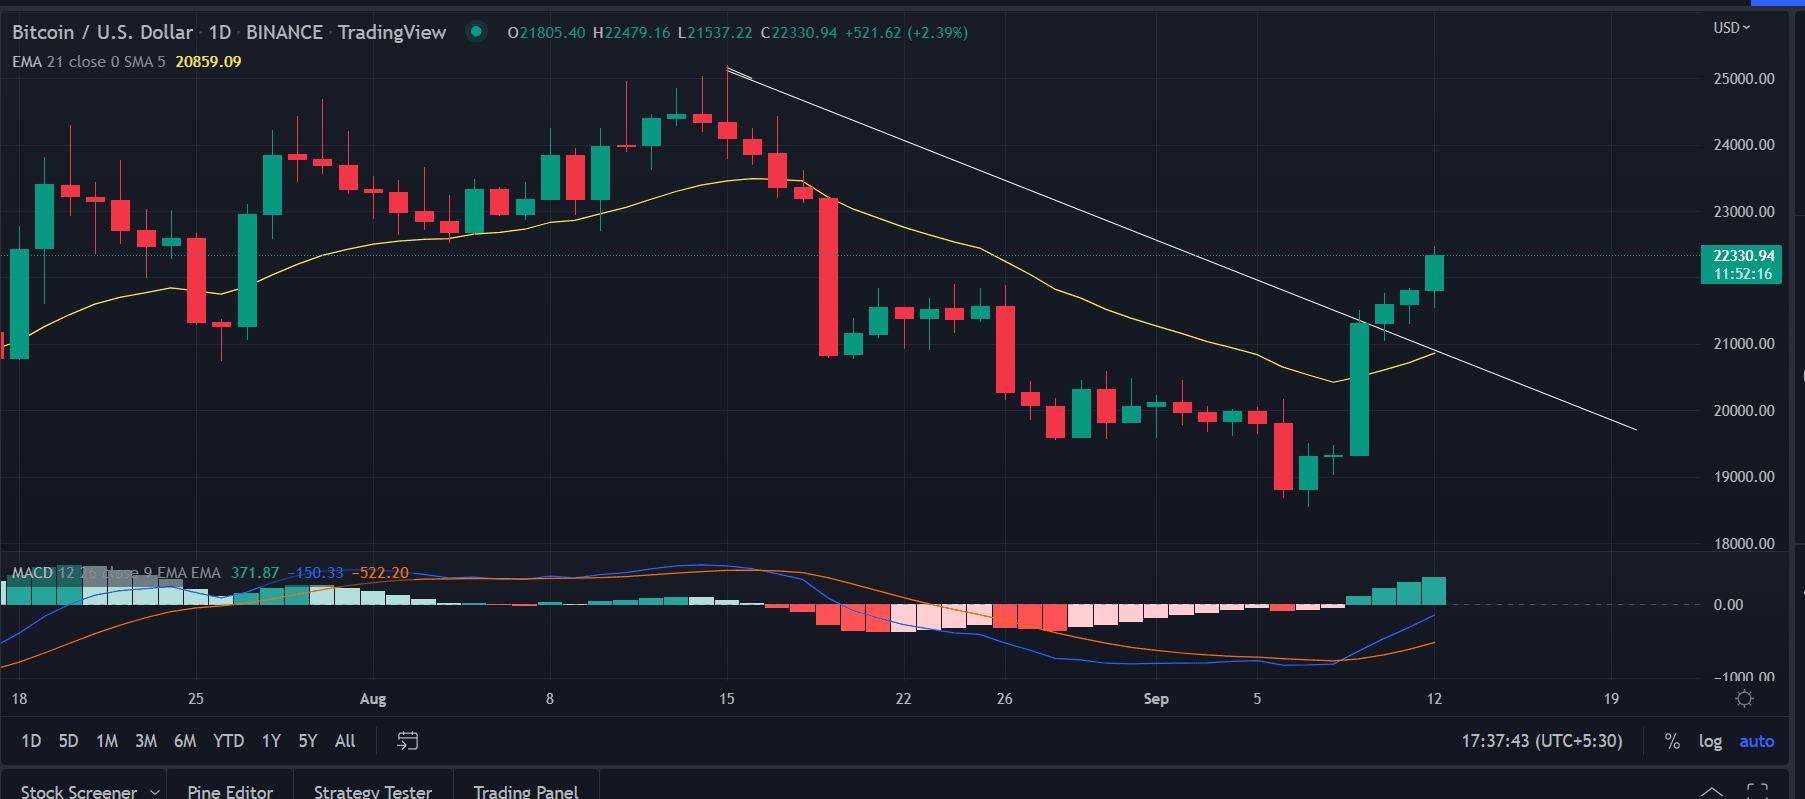
Bitcoin price analysis on the daily chart hints at the continuation of the current upside trend. The bulls managed to tag the critical $22,000 mark amid sustained buying pressure. The renewed buying interest since September 9, when the price zoomed 10% in a single day refused to die any sooner. As can be seen with the rising volumes.
However, if the buyers managed to flip the $22,000 resistance into support, then the gates would be open for further higher levels.
On moving higher, the first upside target would be the high of August 19 $23,217.0. This would provide confirmation that the bulls are in full charge.
Next, the marker participants would target the swing high of $25,200.
To add to the bullish sentiment, the MACD indicator is supporting the view. Although it oscillates below the midline as given a bullish crossover. Further, the rising histogram further signaling at the buying interest in the flagship coin.
In contrast, the greatest of the bearish trendline could turn the tide in the reverse direction. In that case, the immediate support could be located at the 21-day ema at $20,855.
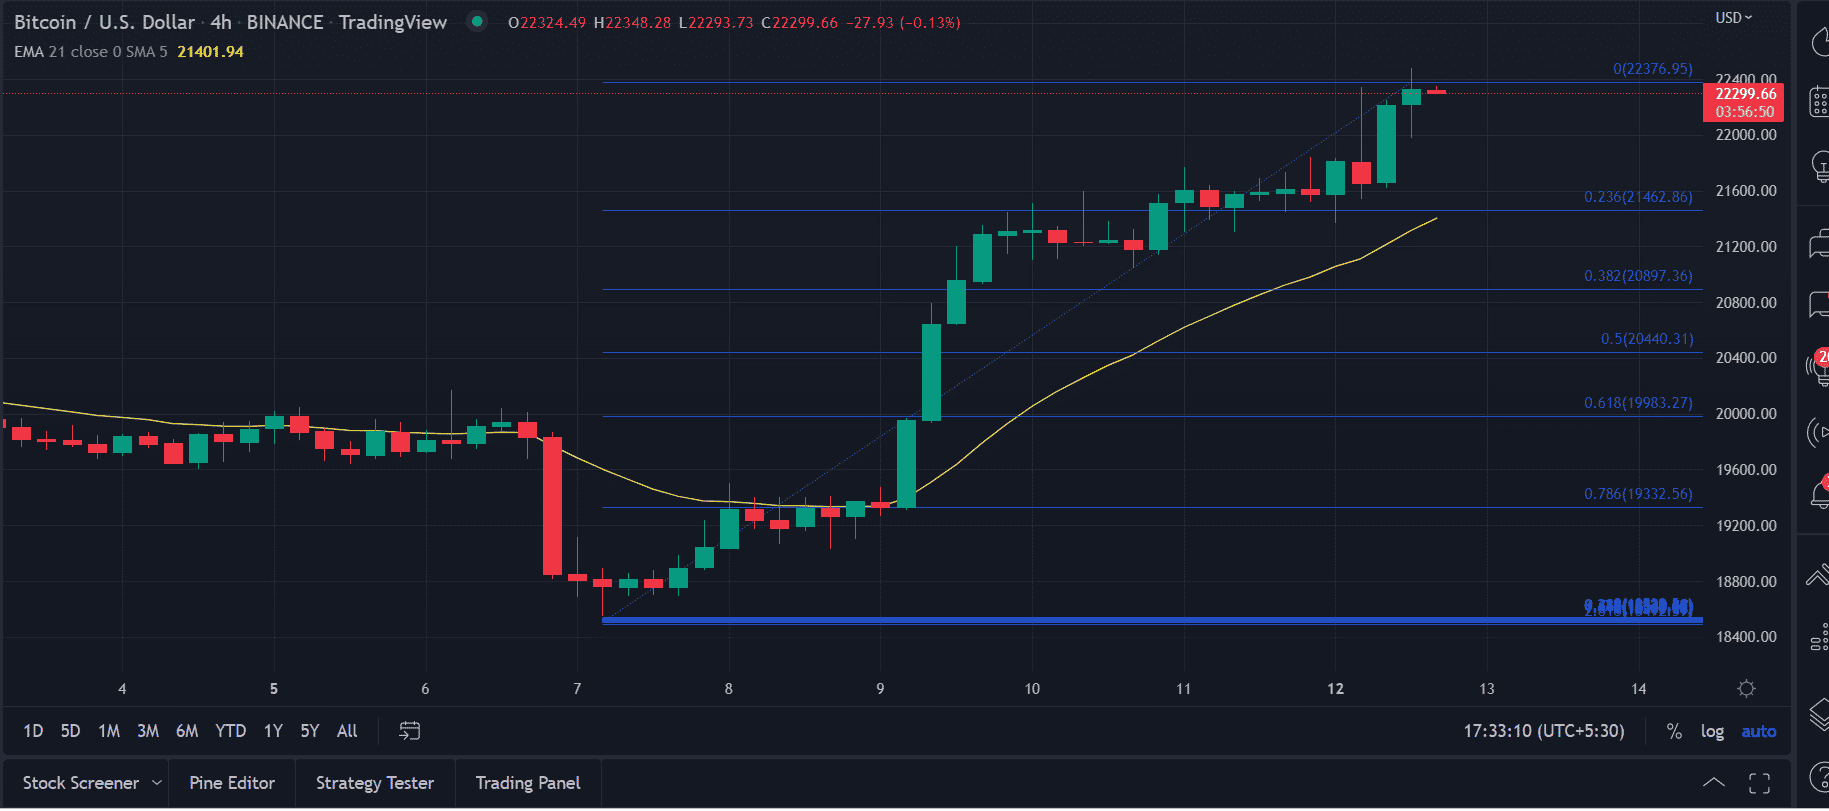
The Fibonacci retracement from the lows of $18,547, indicates a minor correction or pullback in the price on the 4-hour chart. The price could test the 0.23% Fibonacci retracement level at $21,488 if the buying volume dries up.
On the other hand, as the current price action portrays if the bulls produce a closing above the session’s high then the recovery journey could be continued toward $25,000.

Why Trust CoinGape
CoinGape has covered the cryptocurrency industry since 2017, aiming to provide informative insights Read more…to our readers. Our journal analysts bring years of experience in market analysis and blockchain technology to ensure factual accuracy and balanced reporting. By following our Editorial Policy, our writers verify every source, fact-check each story, rely on reputable sources, and attribute quotes and media correctly. We also follow a rigorous Review Methodology when evaluating exchanges and tools. From emerging blockchain projects and coin launches to industry events and technical developments, we cover all facets of the digital asset space with unwavering commitment to timely, relevant information.

Related Articles


- Will Crypto Market Crash as U.S.–Iran War Reportedly Imminent?
- Bitcoin Quantum Threat: CryptoQuant’s CEO Flags Risk of Losing Satoshi’s 1M BTC Stash to Hackers
- Crypto Regulation: Hyperliquid Launches Policy Group to Push DeFi Integration in U.S. Markets
- XRP News: XRPL Activates Permissioned DEX Upgrade to Boost Institutional DeFi Adoption
- WLFI Token Sees 19% Spike Ahead of World Liberty’s Mar-a-Lago Forum Today
- BMNR Stock Outlook: BitMine Price Eyes Rebound Amid ARK Invest, BlackRock, Morgan Stanley Buying
- Why Shiba Inu Price Is Not Rising?
- How XRP Price Will React as Franklin Templeton’s XRPZ ETF Gains Momentum
- Will Sui Price Rally Ahead of Grayscale’s $GSUI ETF Launch Tomorrow?
- Why Pi Network Price Could Skyrocket to $0.20 This Week
- Pi Network Price Beats Bitcoin, Ethereum, XRP as Upgrades and Potential CEX Listing Fuels Demand


