Bitcoin, Ethereum Price Prediction- Are BTC and ETH Ready to Start their Next Recovery Cycle?


Bitcoin, Ethereum Price Prediction: The market leaders continue to move in range-bound movement, creating a sense of a sideways trend. However, the technical chart revealed trading opportunities in this consolidation phase and how it may influence the future price of Bitcoin and Ethereum.
The global cryptocurrency market saw an increase of 1.4% on Thursday at 10:31 am EST, resulting in a total value of $1.1 Trillion in the past 24 hours. Moreover, the market’s overall trading volume plummeted by 1.79% to $62.5 billion. Presently, the DeFi market accounts for $7.09 billion, representing 11.34% of the entire cryptocurrency market’s 24-hour volume.
Top Gainers and Losers
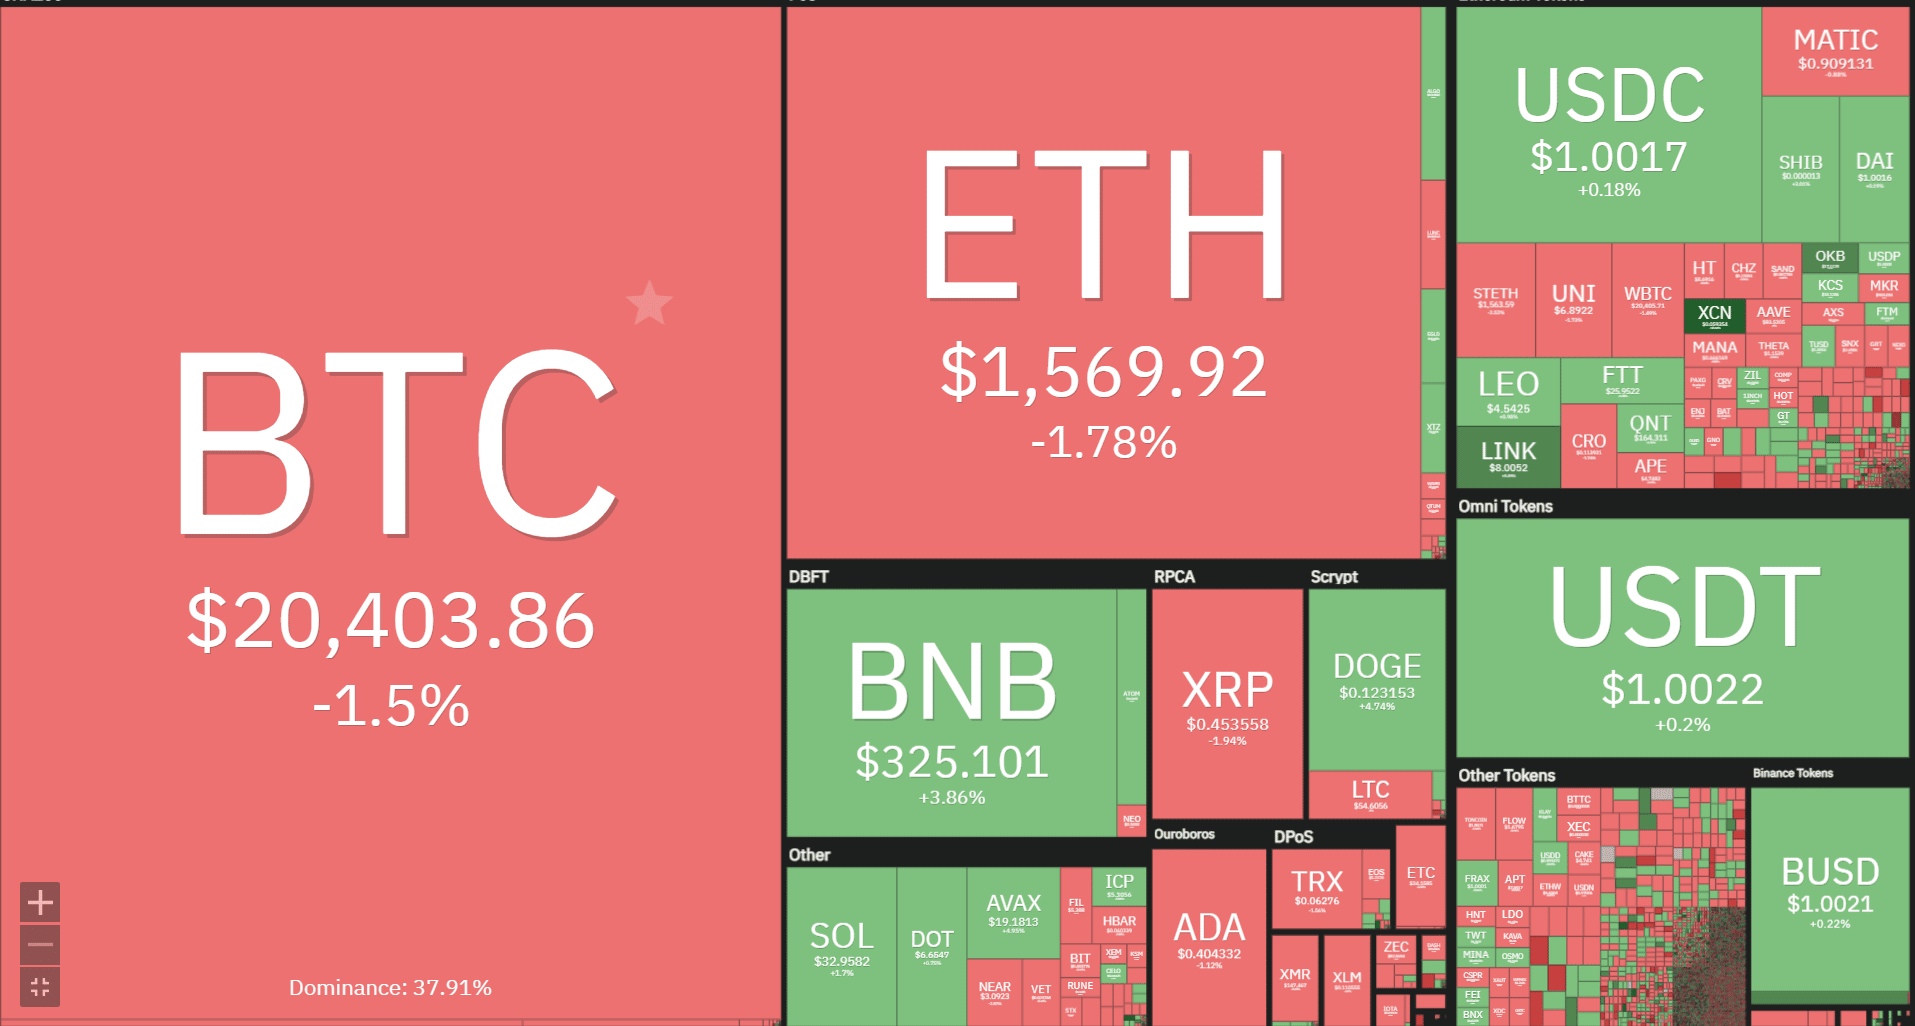 Source- Coin360
Among the top 100 cryptocurrencies Optimism and Enjin Coin showed the highest gains. In the 24 hours, the OP has witnessed a 19.86% hike, pushing its price to $2.94, while ENJ’s price rose by 14.59%, reaching $0.5478. Conversely, Neo and 1inch Network have seen declines in their value, with NEO losing 3.58% and plummeting to $13.01, and 1INCH dropping by 2.50% to $0.6233.
Bitcoin
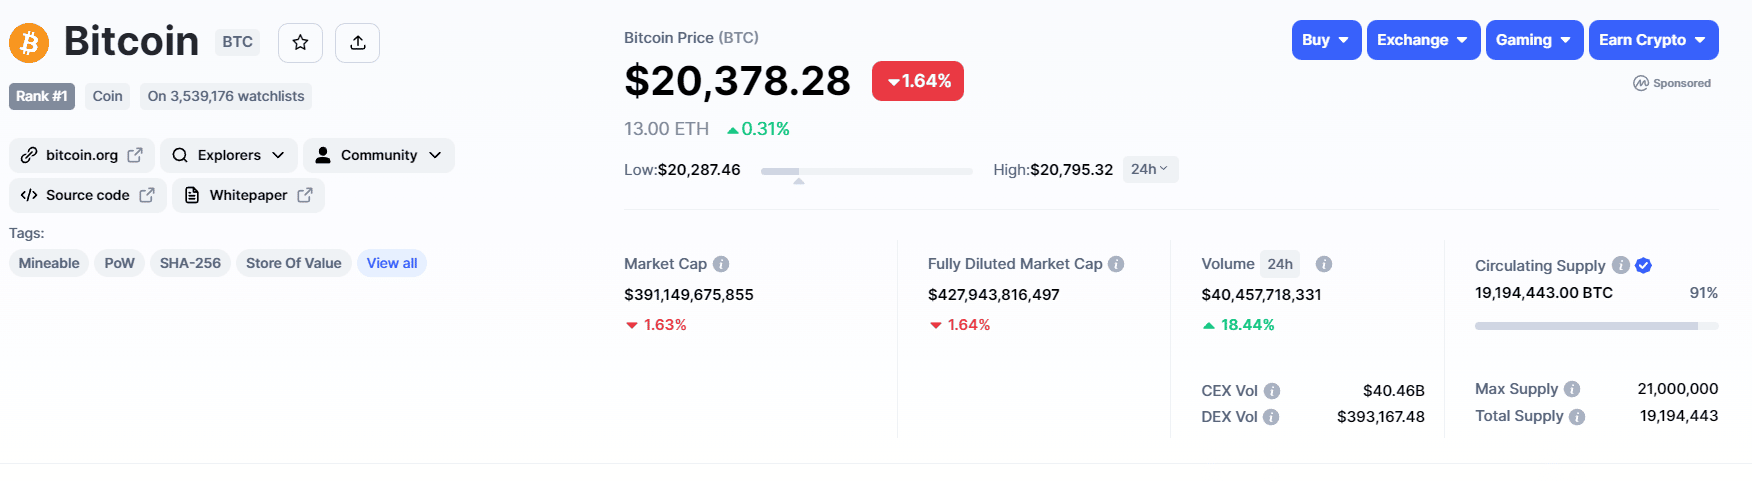 Source- Coinmarketcap
Since last week, the Bitcoin price has been resonating in a range-bound rally stretching from $25100 to $23500. The coin price has retested both these levels twice indicating the traders are actively responding to these levels.
At the press time, the BTC price traded at the $24062 mark and showed a bullish reversal sign at the $23500 range support. This potential reversal could encourage a prolonged consolidation phase and push the prices back to the $25100 mark.
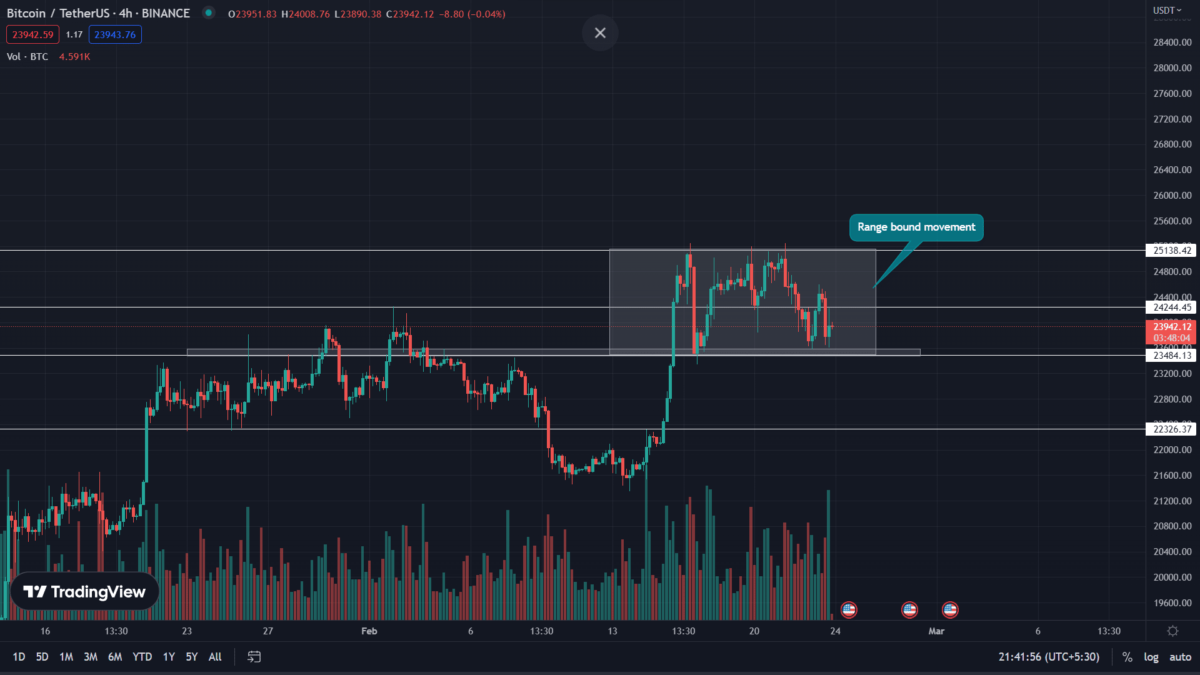 Source-trading view
Thus, the traders looking for an entry should wait for breakout opportunities beyond the aforementioned level. With a higher possibility, a daily candle closing above $25000 will signal the resumption of the bullish trend.
Conversely, a breakdown below $23500 may encourage a bearish correction phase.
Ethereum
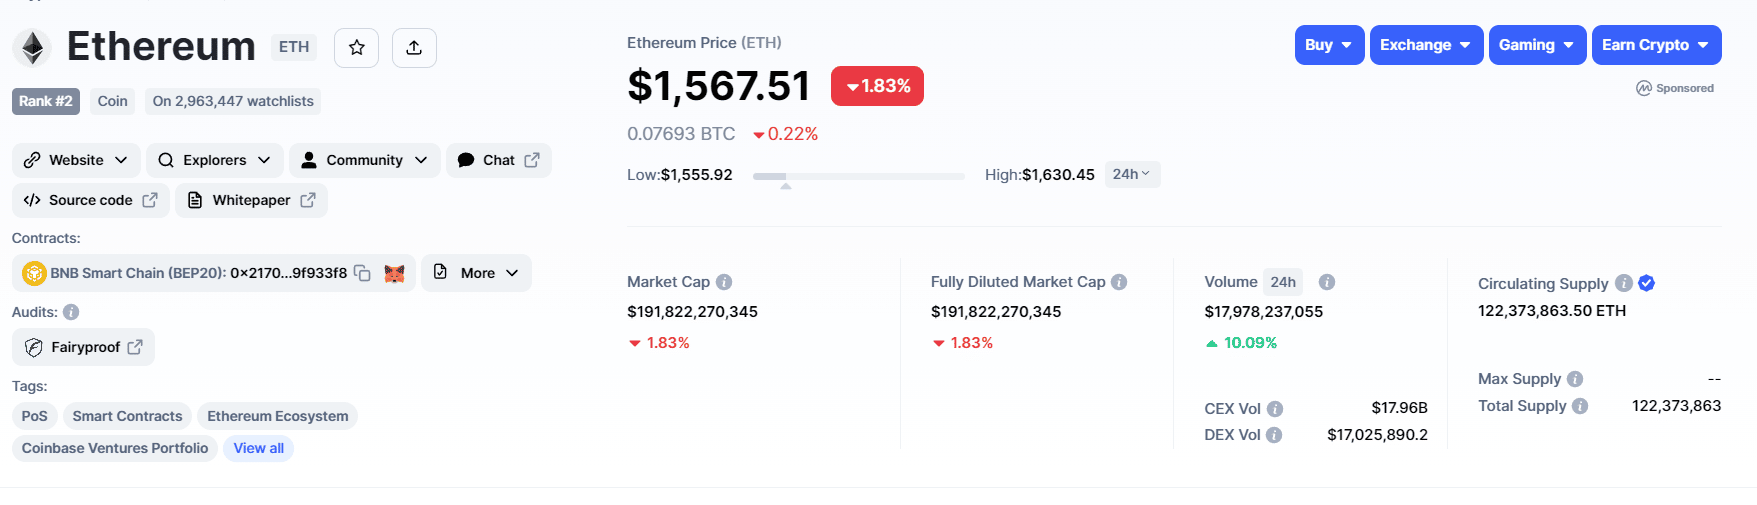 Source- Coinmarketcap
In the daily time frame chart, the Ethereum price wobbling between two diverging trend lines indicates the formation of a megaphone pattern. This continuation pattern usually occurs when the assets have high volatility and indecisiveness from market participants.
On February 21st, the coin price reverted from the pattern’s resistance trendline and plunged 3.5% down to its current price of $1651. Thus, if the selling pressure in the market persists, the ETH price may witness a potential down to $1500 or lower support trendline.
 Source-Tradingview
This chart will be completed when the price breaks out from either of the divergence trendlines. Considering the higher possibility, a bullish breakout from the overhead trendline could set the ETH price to the $1865 or $2000 mark.

Why Trust CoinGape
CoinGape has covered the cryptocurrency industry since 2017, aiming to provide informative insights Read more…to our readers. Our journal analysts bring years of experience in market analysis and blockchain technology to ensure factual accuracy and balanced reporting. By following our Editorial Policy, our writers verify every source, fact-check each story, rely on reputable sources, and attribute quotes and media correctly. We also follow a rigorous Review Methodology when evaluating exchanges and tools. From emerging blockchain projects and coin launches to industry events and technical developments, we cover all facets of the digital asset space with unwavering commitment to timely, relevant information.
Related Articles


- Crypto Traders Reduce Fed Rate Cut Expectations Even as Expert Calls Fed Chair Nominee Kevin Warsh ‘Dovish’
- Crypto, Banks Clash Over Fed’s Proposed ‘Skinny’ Accounts Ahead of White House Crypto Meeting
- XRP News: Ripple Expands Custody Services to Ethereum and Solana Staking
- Bernstein Downplays Bitcoin Bear Market Jitters, Predicts Rally To $150k This Year
- Breaking: Tom Lee’s BitMine Adds 40,613 ETH, Now Owns 3.58% Of Ethereum Supply
- Cardano Price Prediction as Bitcoin Stuggles Around $70k
- Bitcoin Price at Risk of Falling to $60k as Goldman Sachs Issues Major Warning on US Stocks
- Pi Network Price Outlook Ahead of This Week’s 82M Token Unlock: What’s Next for Pi?
- Bitcoin and XRP Price Prediction as China Calls on Banks to Sell US Treasuries
- Ethereum Price Prediction Ahead of Feb 10 White House Stablecoin Meeting
- Cardano Price Prediction as Midnight Token Soars 15%


