Bitcoin Price Analysis: Bulls Aims For $26,000 Amid Sustained Buying


Bitcoin price analysis indicates the sustained buying of the largest coin by market cap. The price made a high just a tad below the $25,000 mark. The levels are last seen in May. This shows that bulls are taking up the lead in the coin. BTC has gained decent bullish momentum on all time frames.
The price successfully closed above the critical resistance of $24,200, which indicates the price would be set for another leg-up. From the current levels, the price could be eyeing the $26,000 mark.
As of press time, BTC/USD is trading at $24,755, up 3.33% for the day. The 24-hour trading volume held near $38,331,878,281 with a gain of more than 46%. A rise in volume along with rising prices is a bullish sign.
- Bitcoin price gained for the second consecutive session near $25,000.
- A decisive move above $24,900 would bring more gains in the coin.
- The RSI favors the bullish outlook.
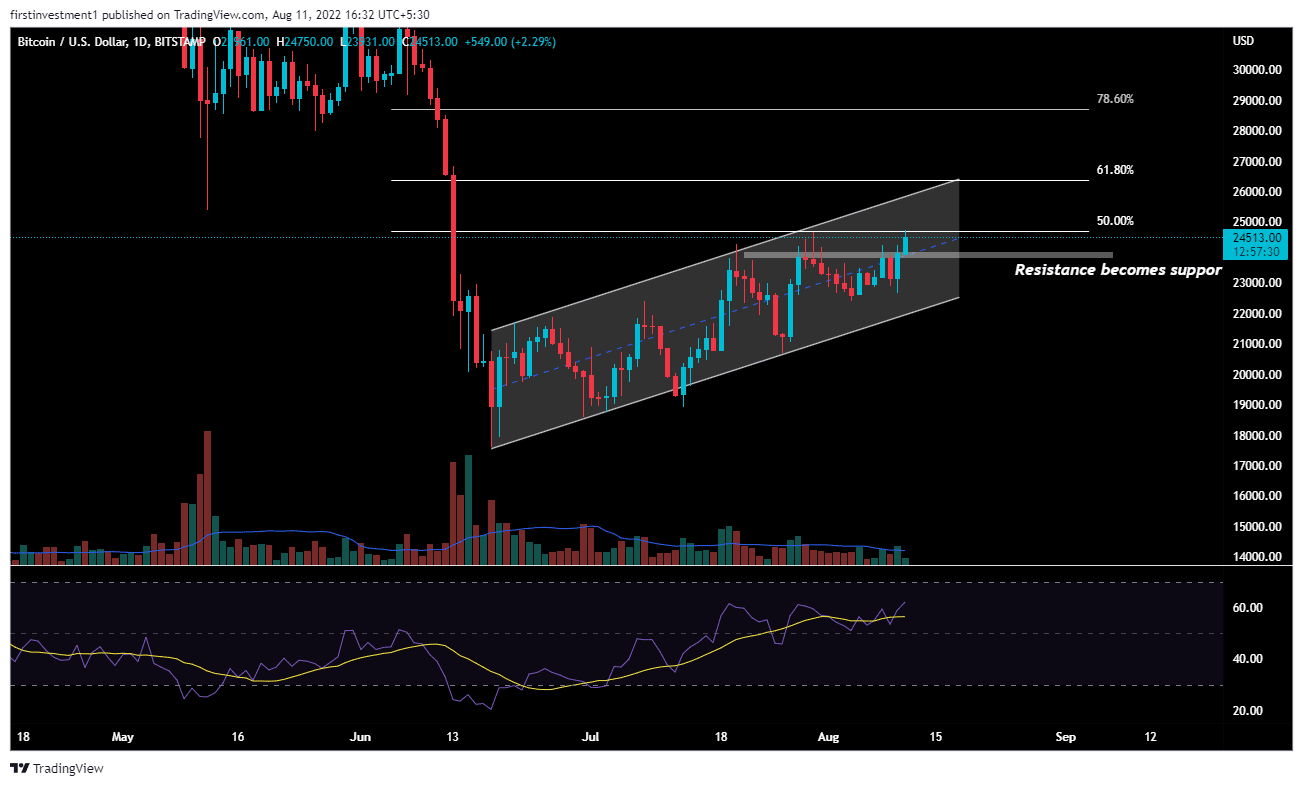
The tables have turned, finally, for BTC. Following an extended range of consolidation below 23,900, the price gave a breakout above the previous trading session. Along with the price breakout, the trading volumes also broke the average line after two weeks of trading below average.
The short-term consolidation extended from July 10 to August 10, and a breakout set the tone for the next price movement which is an upside.
BTC bulls managed to flip the 23,900 resistance zone to the support level.
Currently, the nearest resistance is at 24,800, which also coincides with the 50% Fibonacci retracement, as shown in the charts. There is a higher probability of the price would break on the higher side in the short term.
On the other hand, a break below $24,000 would reverse the gains. In that case, the bear could drag the price towards $23,200.
The RSI (14) is trading above 50, indicating that the average gain is more significant than the average loss. Any uptick would mean the continuation of the upside momentum.
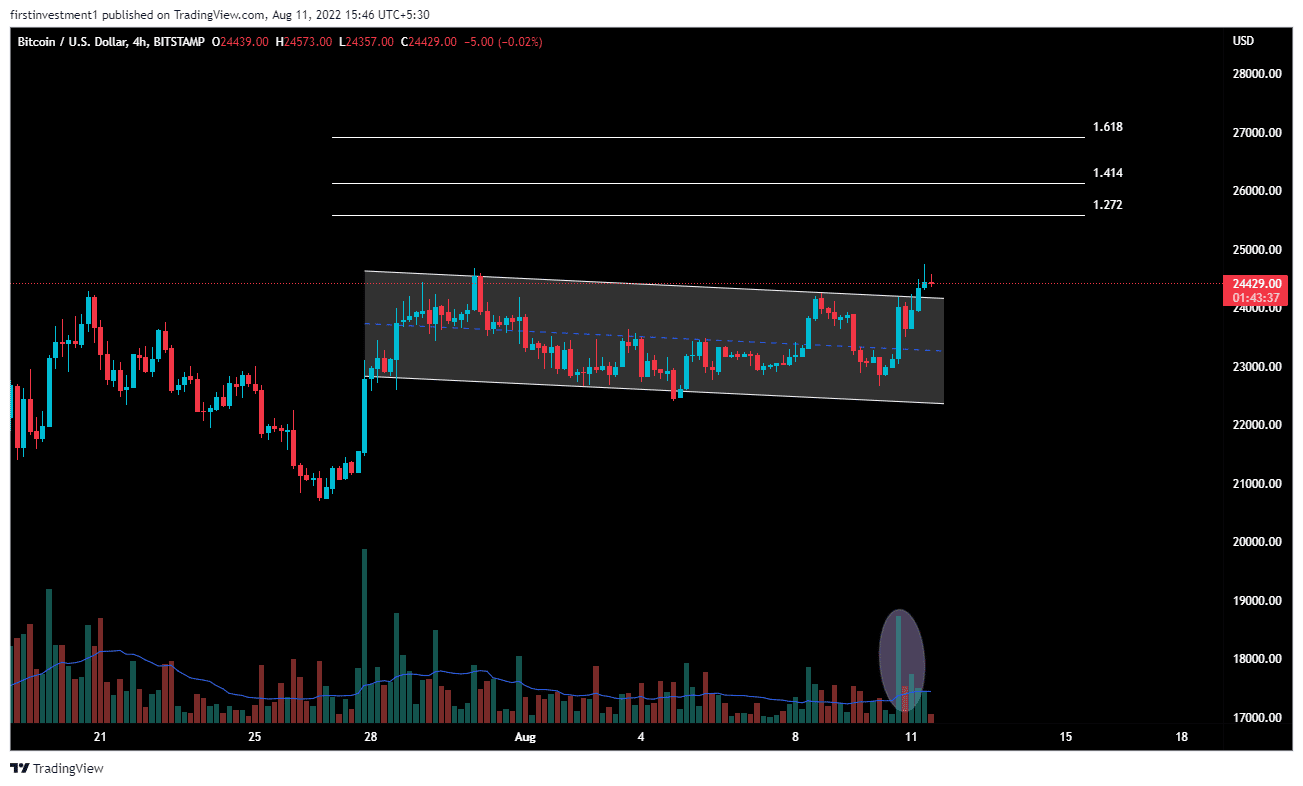
The four-hour chart time frame gave a breakout of a “Flag and Pole” pattern. As you can see in the charts, the breakout candle was small, if compared with a high rising volume of that move, indicating that many big players are exiting or entering their positions near the breakout.
Also read: https://coingape.com/usdt-supply-ratio-crypto-exchange-rises/
There is a slightly high probability of price taking distribution near higher levels, resulting in BTC price falling inside the Flag pattern.
A break below the $23,900 level could invalidate the bullish outlook. And the price can be below 23,200
Conclusion:
BTC is bullish on all time frames. Above $24,750 closing on the hourly time frame, we can put a trade on the buy side.

Why Trust CoinGape
CoinGape has covered the cryptocurrency industry since 2017, aiming to provide informative insights Read more…to our readers. Our journal analysts bring years of experience in market analysis and blockchain technology to ensure factual accuracy and balanced reporting. By following our Editorial Policy, our writers verify every source, fact-check each story, rely on reputable sources, and attribute quotes and media correctly. We also follow a rigorous Review Methodology when evaluating exchanges and tools. From emerging blockchain projects and coin launches to industry events and technical developments, we cover all facets of the digital asset space with unwavering commitment to timely, relevant information.

Related Articles


- Wells Fargo Predicts Bitcoin Rally on $150 Billion ‘YOLO Trade’ Inflow
- Will Crypto Market Crash as U.S.–Iran War Reportedly Imminent?
- Bitcoin Quantum Threat: CryptoQuant’s CEO Flags Risk of Losing Satoshi’s 1M BTC Stash to Hackers
- Crypto Regulation: Hyperliquid Launches Policy Group to Push DeFi Integration in U.S. Markets
- XRP News: XRPL Activates Permissioned DEX Upgrade to Boost Institutional DeFi Adoption
- BMNR Stock Outlook: BitMine Price Eyes Rebound Amid ARK Invest, BlackRock, Morgan Stanley Buying
- Why Shiba Inu Price Is Not Rising?
- How XRP Price Will React as Franklin Templeton’s XRPZ ETF Gains Momentum
- Will Sui Price Rally Ahead of Grayscale’s $GSUI ETF Launch Tomorrow?
- Why Pi Network Price Could Skyrocket to $0.20 This Week
- Pi Network Price Beats Bitcoin, Ethereum, XRP as Upgrades and Potential CEX Listing Fuels Demand


