
Bitcoin Price Analysis: Is $BTC Price Heading Back to $25000?


Bitcoin Price Analysis: On May 29th, the Bitcoin price turned down from the resistance trendline of the channel pattern. This bearish reversal within the channel indicates the BTC price is likely to continue on a correction path which may also plunge below the $26000 monthly low. Here’s how this pattern could further influence the BTC’s future trend.
Also Read: Bitcoin Outperforms Gold, Crude Oil; Bitcoin Bull Run Ahead?
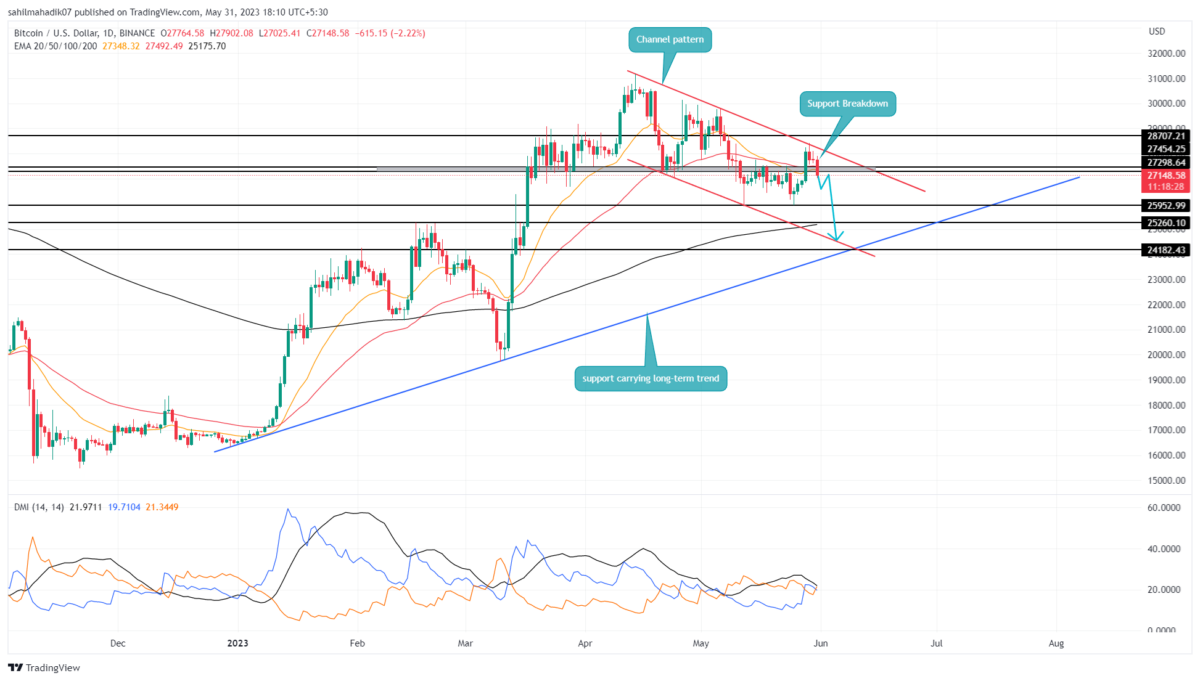
Bitcoin Price Daily Chart
- Usually, a bearish reversal from this pattern’s resistance trendline recuperates the selling momentum and plunges the price back to a lower trendline.
- A breakdown below the $27500-$27300 support zone intensifies the supply pressure to prolong the prior downfall.
- The intraday trading volume in Bitcoin is $15.5 Billion, indicating a 19% gain.
 Source-Tradingview
With an intraday loss of 2.22%, the Bitcoin price breached a significant support zone of $27500-$27300. The buyers very recently reclaimed this level, and an instant breakdown indicates the market participants continue to sell on price rallies.
If the daily candle closes below the $27300 level, interested traders may get an opportunity to short-sell and boost the supply pressure in the market. Therefore, the resulting downfall may plunge the BTC price to $24500 creating a new lower low in its ongoing downtrend.
While things look bearish for the Bitcoin price, a decisive breakout above the channel pattern’s trendline will undermine the bearish momentum and may trigger a new recovery rally.
Will Bitcoin Price Break Below $25000?
In theory, a bearish reversal from the resistance trendline of the channel pattern is most likely to trigger a downfall to $25000. Thus, with sustained selling the ongoing bear cycle in Bitcoin may plunge the prices below $26000 and $25200 support to hit the lower trendline near $24600.
- Directional Moving Index: A DI- slope(orange) crossing above the D+ slope(blue) projects a bear trend sentiment in the market.
- Exponential Moving Average: Along with the $27300 support breakdown, the BTC buyers also lost the 20-and-50-day EMAs giving an extra edge to short-sellers.

Why Trust CoinGape
CoinGape has covered the cryptocurrency industry since 2017, aiming to provide informative insights Read more…to our readers. Our journal analysts bring years of experience in market analysis and blockchain technology to ensure factual accuracy and balanced reporting. By following our Editorial Policy, our writers verify every source, fact-check each story, rely on reputable sources, and attribute quotes and media correctly. We also follow a rigorous Review Methodology when evaluating exchanges and tools. From emerging blockchain projects and coin launches to industry events and technical developments, we cover all facets of the digital asset space with unwavering commitment to timely, relevant information.


- Bernstein Says Bitcoin Has Bottomed Even as U.S.-Iran Peace Talks Remain Uncertain
- Monero Privacy Demand Hits Record Highs: How GhostSwap Is Meeting the BTC to XMR Surge
- Goldman Sachs Defies Oil Surge with Bold 2026 Fed Rate Cut Forecast
- Bitcoin Risks Fall as US-Israel Strikes Iran’s Energy Facilities Despite Trump’s 5-Day Pause
- Crypto Leaders Call Stablecoin Yield Text Language in CLARITY Act as “Restrictive”
- Dogecoin, Shiba Inu, and Pepe Coin Price Outlook as Markets Rise on U.S.–Iran Temporary Pause
- Bittensor (TAO) Price Soars 80% MoM Outperforming Bitcoin- Is It A Good Time to Buy?
- Top Factors Behind Shiba Inu (SHIB) Price Surging Today
- Gold Vs BTC: Bitcoin Outperforms Gold by 23% – Is $75K Next Amid Trump’s Five Day Pause
- Crypto Stocks to Watch As Trump Issues 48-Hour Iran Ultimatum- CRCL, COIN, and MSTR Price Analysis
- XRP Price Prediction Ahead of March 27 SEC Spot ETF Decision


