Bitcoin Price Analysis: Low Volume Retest Tease Further downfall in BTC


The One-Month consolidation in Bitcoin(BTC) price ended on a bearish note as sellers breached the $28000 on June 12th. Amid the Last week’s crypto crash, the coin price marked a new 2022 low at $17708. Doing so, the BTC price poked $20000 psychological support, suggesting further decline
Key points:
- The BTC price lost 39% within a fortnight
- The Onchain indicator MVRV- Z score indicates Bitcoin is undervalued
- The intraday trading volume in the Bitcoin is $44.8 Billion, indicating a 36% gain
MVRV-Z score Hints Bitcoin Nearing Bottom
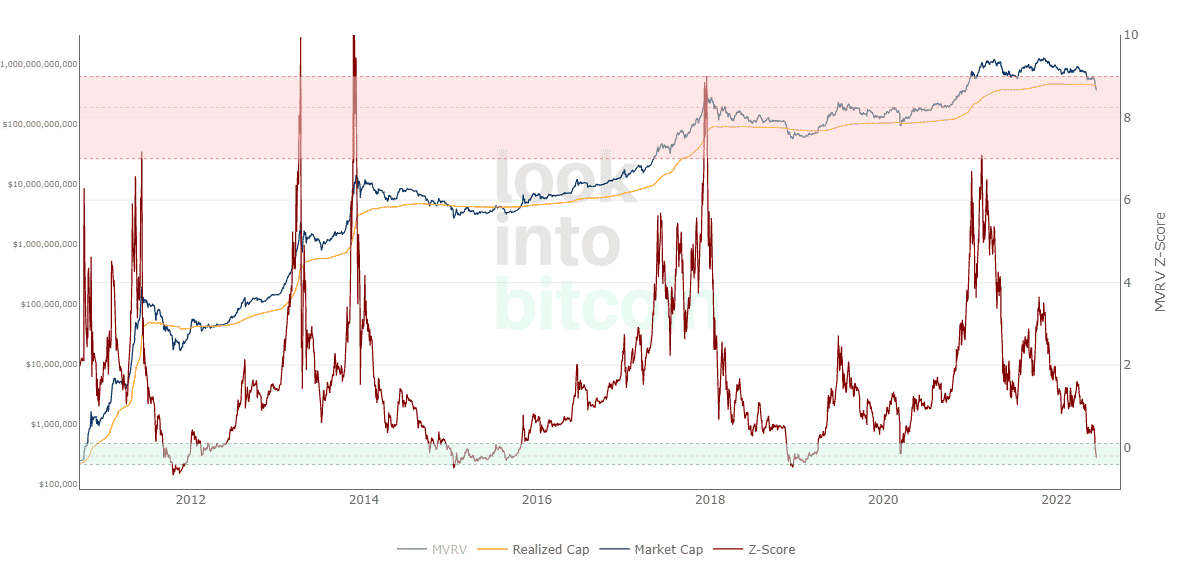 Source-lookintobitcoin
The Onchain indicator MVRV- Z score uses the deviation between the assets’ market cap and realized cap to undermine whether it is overvalued or undervalued relative to its value.
A high volume(near the red zone) has historically determined the market top; conversely, the low value(blue) has the signal market bottom.
Thus, last week’s sell-off pushed the Z-score below the 0.22 mark(Blue zone), previously witnessed in 2020, 2018, 2015, and 2011, which also signaled the market bottom.
However, it’s worth noting the BTC price didn’t start rallying immediately after they visited this oversold region. Therefore, it’s safe to assume the coin price could slide lower or consolidate for a few more sessions before finding a bottom.
BTC/USDT daily Time Frame Chart
 Source-Tradingview
From May 10th to June 11th, the Bitcoin(BTC) price consolidated above the $28000 support, as it took a pause from the April-May bloodbath. However, last week the crypto market experienced intense selling pressure, resulting in a $28000 fallout.
The resulting fall knocked out more support levels such as $24000 and just recently $20000. Today, the BTC price is up by 2% and retests the breached support. Furthermore, the low volume activity observed during the retest phase suggests price sustainability below $20000.
If the selling pressure persists, the coin price may drop 27% lower to $14000 psychological support.
Conversely, if buyers push the BTC price above $20000, the traders can expect a minor relief till $24000 or $28000 resistance.
Technical indicator-
The daily-RSI slope dives deeper into the oversold region, indicating sellers continue strengthening their grip over the coin. This discounted price should eventually attract potential buyers to drive the price higher.
The rising ADX slope accentuates steady selling with no sign of weakness in bearish momentum.
- Resistance level- $20000, and $24000
- Support level- $18000 and $14000

Why Trust CoinGape
CoinGape has covered the cryptocurrency industry since 2017, aiming to provide informative insights Read more…to our readers. Our journal analysts bring years of experience in market analysis and blockchain technology to ensure factual accuracy and balanced reporting. By following our Editorial Policy, our writers verify every source, fact-check each story, rely on reputable sources, and attribute quotes and media correctly. We also follow a rigorous Review Methodology when evaluating exchanges and tools. From emerging blockchain projects and coin launches to industry events and technical developments, we cover all facets of the digital asset space with unwavering commitment to timely, relevant information.
Related Articles


- BlackRock Signal Further Downside for Bitcoin And Ethereum As It Moves $170M to Coinbase
- Just-In: Binance Buys Additional 1,315 BTC for SAFU Fund
- Big Short Michael Burry Issues Dire Warning on Bitcoin Price Crash Risks
- Kevin Warsh Nomination Hits Roadblock as Democrats Demand Answers on Powell, Cook
- Crypto Market Bill Set to Progress as Senate Democrats Resume Talks After Markup Delay
- Bitcoin Price Prediction As US House Passes Government Funding Bill to End Shutdown
- Ondo Price Prediction as MetaMask Integrates 200+ Tokenized U.S. Stocks
- XRP Price Risks Slide to $1 Amid Slumping XRPL Metrics and Burn Rate
- Gold and Silver Prices Turn Parabolic in One Day: Will Bitcoin Mirror the Move?
- Cardano Price Prediction as the Planned CME’s ADA Futures Launch Nears
- HYPE Price Outlook After Hyperliquid’s HIP-4 Rollout Sparks Prediction-Style Trading Boom


