Bitcoin Price Dips By 3%, Is This Rally A Bull Trap?


The Bitcoin price witnessed a remarkable rally in the first three weeks of 2023. The bull run registered 42% growth from the January 1st low of $16499 and pushed the price to a $23400 mark. However, in the fourth week, the BTC started to show hesitation in a bullish recovery week, as several global events were about to unfold. Here’s how the largest cryptocurrencies may react amid upcoming events
Key points:
- A daily candle closing below the $23400 mark could trigger a longer correction in BTC
- Bitcoin’s fear and greed index at 61% indicates the market sentiment is still bullish
- The intraday trading volume in Bitcoin is $26.2 Billion, indicating a 2% gain
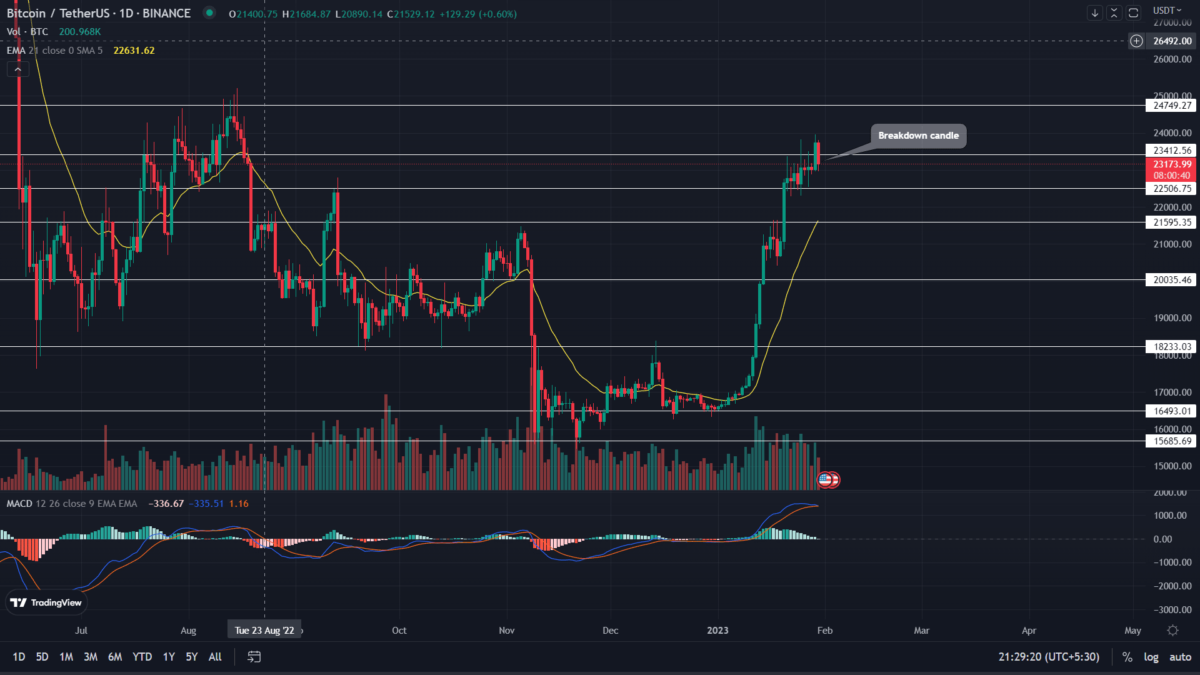 Source-Tradingview
During the fourth week of 2023, the Bitcoin price started resonating between the $23400 and $22500 levels. The daily candles showing long rejections on both ends indicated uncertainty among market participants. This indecisiveness could be backed by upcoming events such as interest rate hikes by the US Fed, Europe Central Bank, and Bank of England.
However, on January 29th, the Bitcoin price witnessed a significant inflow and breached the overhead resistance of $23400. This breakout hints at the release of bullish momentum and a higher chance for uptrend continuation.
However, the Bitcoin price dropped 3% today and reenters the above-mentioned range. This downfall points to the prior breakout as a bull trap and a threatened coin price for a long correction.
Also Read: Top Crypto Discord Servers/Groups Worth Joining In 2023
If the daily candle closes below the $23400 mark, the BTC price will likely continue its consolidation in a narrow range or will dive deeper to revisit the $21600 or $19000 support. In addition, this downfall could force the liquidation of hasty buyers who entered on the $23400 breakout.
On a contrary note, if by the day’s end, the buyers push the candle closing above the $23400 mark, the bullish momentum will retain and drive the Bitcoin price higher.
Technical Indicator
MACD: the MACD(blue) and the signal(orange) lines on the verge of bearish crossover indicate the exhausted bullish momentum.
EMAs: the reclaimed EMAs (20, 50, 100, and 200) could offer suitable support during a bearish pullback.
Bitcoin Price Intraday Levels
- Spot rate: $23176
- Trend: Bearish
- Volatility: High
- Resistance levels- $25000 and $28000
- Support levels- $22500 and $21500

Why Trust CoinGape
CoinGape has covered the cryptocurrency industry since 2017, aiming to provide informative insights Read more…to our readers. Our journal analysts bring years of experience in market analysis and blockchain technology to ensure factual accuracy and balanced reporting. By following our Editorial Policy, our writers verify every source, fact-check each story, rely on reputable sources, and attribute quotes and media correctly. We also follow a rigorous Review Methodology when evaluating exchanges and tools. From emerging blockchain projects and coin launches to industry events and technical developments, we cover all facets of the digital asset space with unwavering commitment to timely, relevant information.
Related Articles


- Crypto, Banks Clash Over Fed’s Proposed ‘Skinny’ Accounts Ahead of White House Crypto Meeting
- XRP News: Ripple Expands Custody Services to Ethereum and Solana Staking
- Bernstein Downplays Bitcoin Bear Market Jitters, Predicts Rally To $150k This Year
- Breaking: Tom Lee’s BitMine Adds 40,613 ETH, Now Owns 3.58% Of Ethereum Supply
- Bitget Partners With BlockSec to Introduce the ‘UEX Security Standard’ Amid Quantum Threats to Crypto
- Cardano Price Prediction as Bitcoin Crashes Below $70k
- Bitcoin Price at Risk of Falling to $60k as Goldman Sachs Issues Major Warning on US Stocks
- Pi Network Price Outlook Ahead of This Week’s 82M Token Unlock: What’s Next for Pi?
- Bitcoin and XRP Price Prediction as China Calls on Banks to Sell US Treasuries
- Ethereum Price Prediction Ahead of Feb 10 White House Stablecoin Meeting
- Cardano Price Prediction as Midnight Token Soars 15%


