Bitcoin Price May Revisit Its $18800 Accumulation Zone; Buy Again?
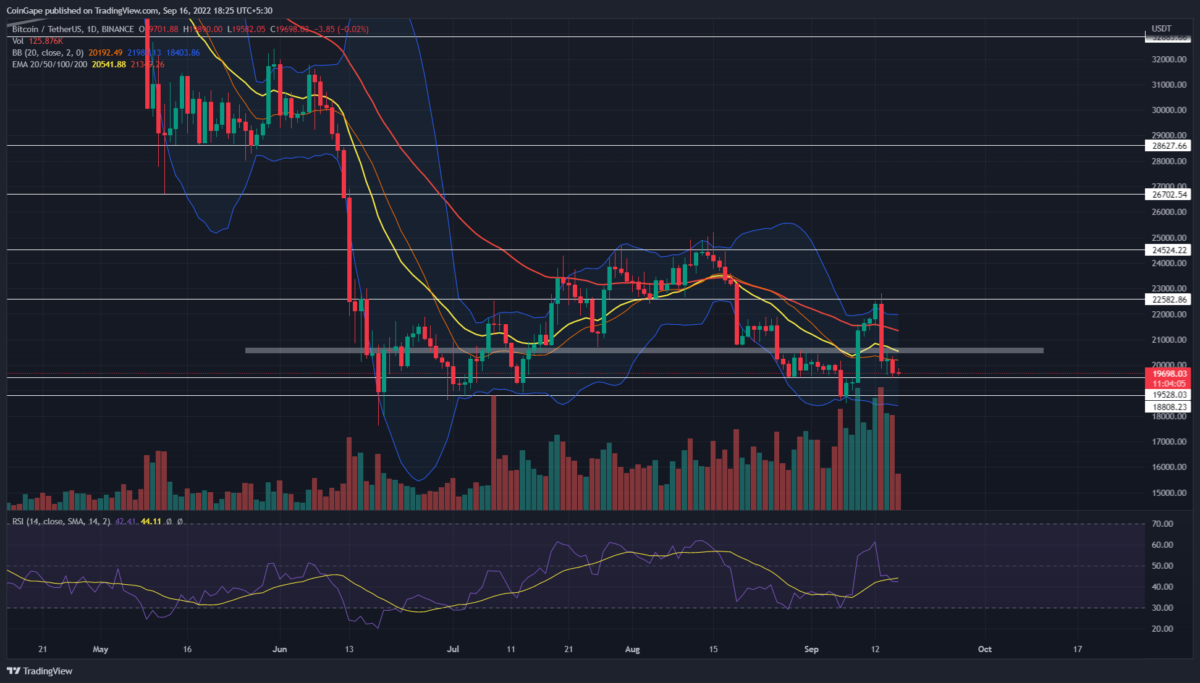
The Bitcoin daily technical chart accentuates an ongoing sideways rally. The $24500 resistance has acted as a growth limiter, registering the price action to reach higher levels. On the flip side, the $18800 provides bottom support for the range-bound rally. The Bitcoin price currently shows a reversal sign at the nearest support of $19500, and thus, the coin traders can witness a minor pullback before the prices continue their downfall.
Key points:
- The $19500 support bolstered a 5% relief rally before the resumption of the prevailing downfall.
- The coin holder lost 20-and-50-day EMA support with the recent price drop
- The intraday trading volume in Bitcoin is $30.1 Billion, indicating a 22% loss
Source-Tradingview
The last bounce back from the $18800 support surged the Bitcoin price $20.2% higher to hit the $22600 barrier. However, the recent news of high CPI data caused a sharp sell-off in the crypto market on September 13th and tumbled the coin price by 9.5%.
The bearish engulfing candle breached the $20600, 20-and-50-day EMA altogether. Thus, the accelerated bearish momentum plummeted another 5% to reach minor support of $19500.
Also read: Here’s When Bitcoin (BTC) Price May Reclaim The 200-WMA Again
A low-volume Doji candle at this support indicates market participants’ uncertainty. This $19500 mark may likely bolster a minor bullish pullback to retest the $20600 mark as potential resistance.
If the selling pressure persists, the bitcoin price will continue its downfall to the $18800 accumulation zone.
Technical indicator
Bollinger band indicator: with the $20600 breakdown, the coin holders lost this indicator’s midline, which indicates that sellers have trend control.
Relative strength index: the daily RSI slope nosedived below the mean line, and 20-SMA indicates a negative sentiment building up. However, concerning the price retest to $18800, bottom support and the daily and weekly RSI slope shows a significant divergence.
This divergence reflects a strong possibility of Bitcoin rebounding from $18800 support.
Bitcoin Price Intraday Levels
- Spot rate: $19663
- Trend: Bearish
- Volatility: Low
- Resistance level- $22550 and $25000
- Support level- $20800 and $18830
Recent Posts
- Price Analysis
Expert Predicts a 246% Shiba Inu Price Surge as a Rare Pattern Forms
Shiba Inu price continued its strong bull run on Monday, reaching its highest point since…
- Price Analysis
XRP Price Eyes a 65% Rally Amid $43.16M Weekly Spot ETFs Inflows
XRP price has stabilized after months of controlled downside, aligning with a broader crypto market…
- Price Analysis
Will Ethereum Price Hold $3,100 Level Amid U.S.-Venezuela Conflict?
As the crypto market extended its rally, Ethereum price held firm above the $3,100 level…
- Price Analysis
Pi Network Price Eyes $0.3+ as Protocol v23 Rolls Out Rust Smart Contracts and DEX Plans
Pi Network Price hovered on Monday after a steady recovery, climbing above $0.2100 amid positive…
- Price Analysis
Shiba Inu Price Surges 32% in 2026 as Top Wallet Holds $3.3B in SHIB: Is a Bigger Rally Coming Next?
Shiba Inu price has jumped 32% in 2026, riding a strong meme coin recovery and…
- Price Analysis
Weekly Crypto Price Prediction: Bitcoin, Ethereum and XRP
Bitcoin, Ethereum, and XRP prices are rallying following a sharp increase in overall market momentum. …