

Can Ethereum ($ETH) Price Find Support at $1825 Amid Market Sell-off?


The Ethereum (ETH) price experienced a significant downturn this week, breaching the recently reclaimed monthly barrier of $1922. This decline signaled a failure to sustain a higher price, potentially leading to further selling pressure. Adding to the negative sentiment were concerns about the US Federal Reserve’s tightening policies. As a result, ETH witnessed a 5% drop over the last two days, reaching a low of $1825.
Also Read: Ethereum Price Prediction As Dips Become Profitable: Rebound To $2k In The Offing?
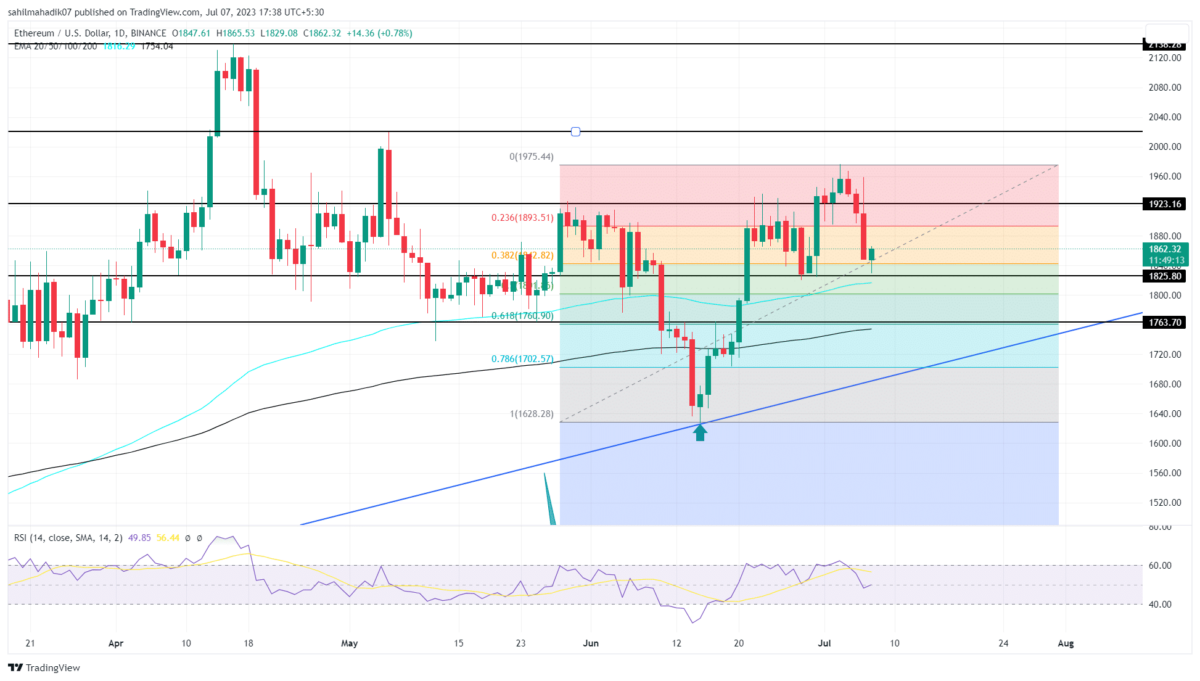
Ethereum Price Daily Chart
- The ETH price plunged below the $1922 flipped support, signaling a potential bull trap and triggering selling pressure.
- Healthy retracement could pour more buying orders at $18250 support
- The intraday trading volume in Ether is $8.7 Billion, indicating a 31% gain.
 Source- Tradingview
On June 5th, the Ethereum price plunged below the flipped support of $1922, indicating a potential bull trap. This development led to increased selling sentiment among investors, further pressuring the ETH price.
As a result, the altcoin experienced a 5% drop in just two days, reaching a low of $1825. However, this support level aligned with the 38.2% Fibonacci retracement level provided a temporary pause in the falling prices, indicating a potential area where buyers might step in.
A retracement to the 32.2% FIB is still considered healthy for the overall trend and therefore, the second-largest cryptocurrency is in a bullish trend. If the coin price shows sustainability above $1825 this week, the buyers could rebound and challenge the $2000 mark.
Will Ethereum Price Witness Long Correction?
If the selling pressure continues and breaches $1825 support, the sellers will likely prolong the downfall in ETH price. In such a scenario, the coin holders could see a potential 7% decline to reach the long-coming support trendline. The support trendline represents a historically significant level where buyers have shown interest to accumulate dips.
- Exponential Moving Average: The 100-day EMA slope near $1825 increases the support strength of this level.
- Relative Strength Index: The daily-RSI slope at 50% reflects a neutral sentiment among traders.

Why Trust CoinGape
CoinGape has covered the cryptocurrency industry since 2017, aiming to provide informative insights Read more…to our readers. Our journal analysts bring years of experience in market analysis and blockchain technology to ensure factual accuracy and balanced reporting. By following our Editorial Policy, our writers verify every source, fact-check each story, rely on reputable sources, and attribute quotes and media correctly. We also follow a rigorous Review Methodology when evaluating exchanges and tools. From emerging blockchain projects and coin launches to industry events and technical developments, we cover all facets of the digital asset space with unwavering commitment to timely, relevant information.
Premium Partners


Related Articles


- ETH Treasury: Trend Research Uses USDT Loans to Expand Holdings to $1.8B, Eyes 2026 Bull Run
- USDC Supply Shrinks: USDC Treasury Burns 51M Tokens on Solana
- XRP News: Ripple Expert Slams XRP Supply Shock Theory, Cites Bitcoin’s Influence
- Breaking: China’s PBOC Reveals Action Plan to Boost Digital Yuan Adoption From 2026
- Here’s Why Bitcoin, ETH, XRP, SOL Are Going Up Today
- Solana Price Prediction: How High Could SOL Go in January 2026?
- Top 3 Predictions for Bitcoin price, Ethereum price and XRP price for 2026 According to Analysts
- Is $1 Dogecoin Price Technically Possible in 2026?
- Bitcoin Price Year-End Prediction: Analysts Highlight Key Levels Before 2025 Close
- Pi Network Price Holds $0.20 After 8.7M PI Unlock, 19M KYC Milestone-What’s Next?
- XRP Price Prediction Ahead of US Strategic Crypto Reserve


