Crypto Gem: This Proof Of Meme (POM) Crypto Coin Is Up Almost 3000% Over Last year


The Constellation (DAG) price is still trapped in a moderate correction phase. The DAG/USD price started a recovery rally as the coin was entering the year 2022. However, a descending trendline is interrupting any bullish rally trying to reclaim the higher level.
 Source-Tradingview
Historical Performance
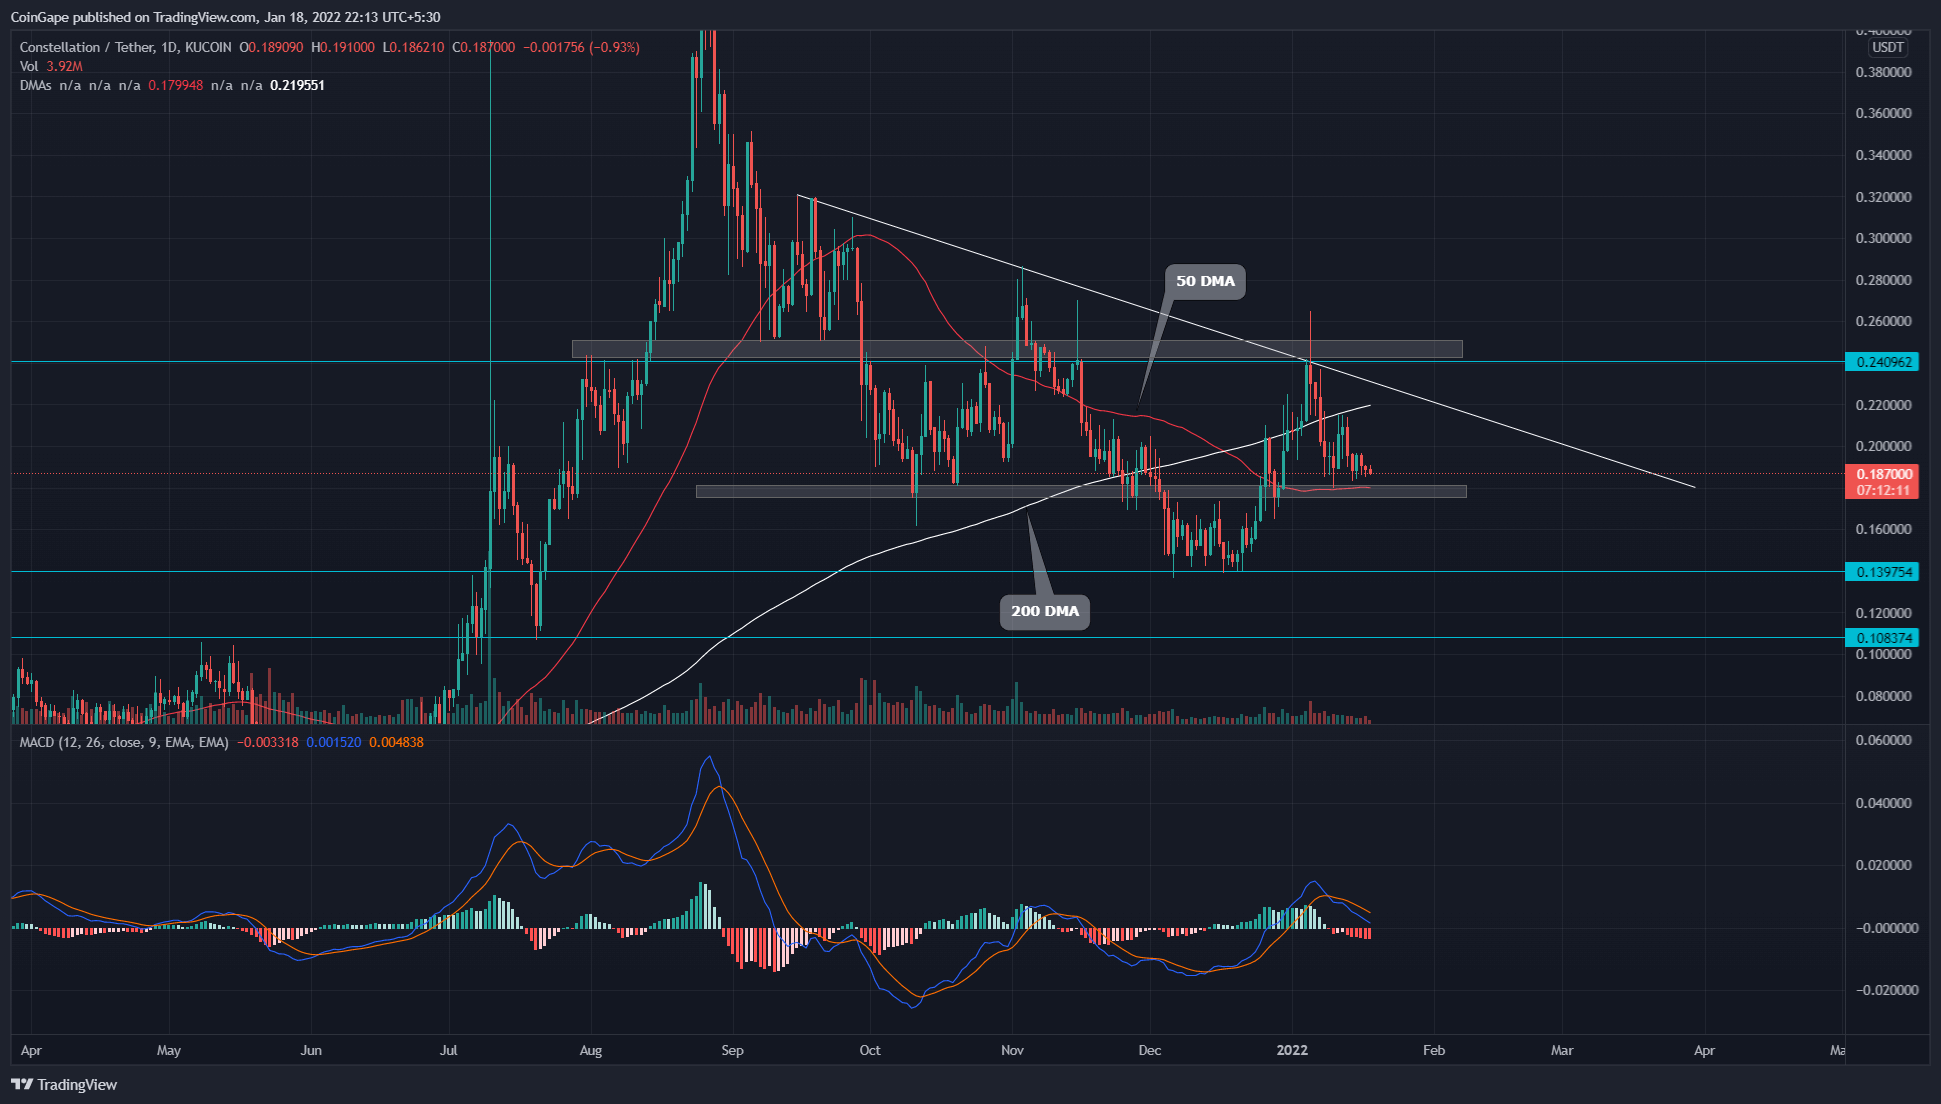
During the third quarter of 2021, the DAG coin parabolic rally entered a correction phase. This moderate pullback plunged the price to the $0.14 mark, indicating around 70% loss from the All-Time High($0.462).
The DAG price obtained sufficient demand from this bottom support($0.14) and initiated a new recovery rally. However, the price rallied to the $0.24 mark, faced strong resistance from an upcoming resistance trendline, pushing the coin price back to the lower levels.
Descending trend brings 23% discount on Constellation (DAG) Price
 Source-Tradingview
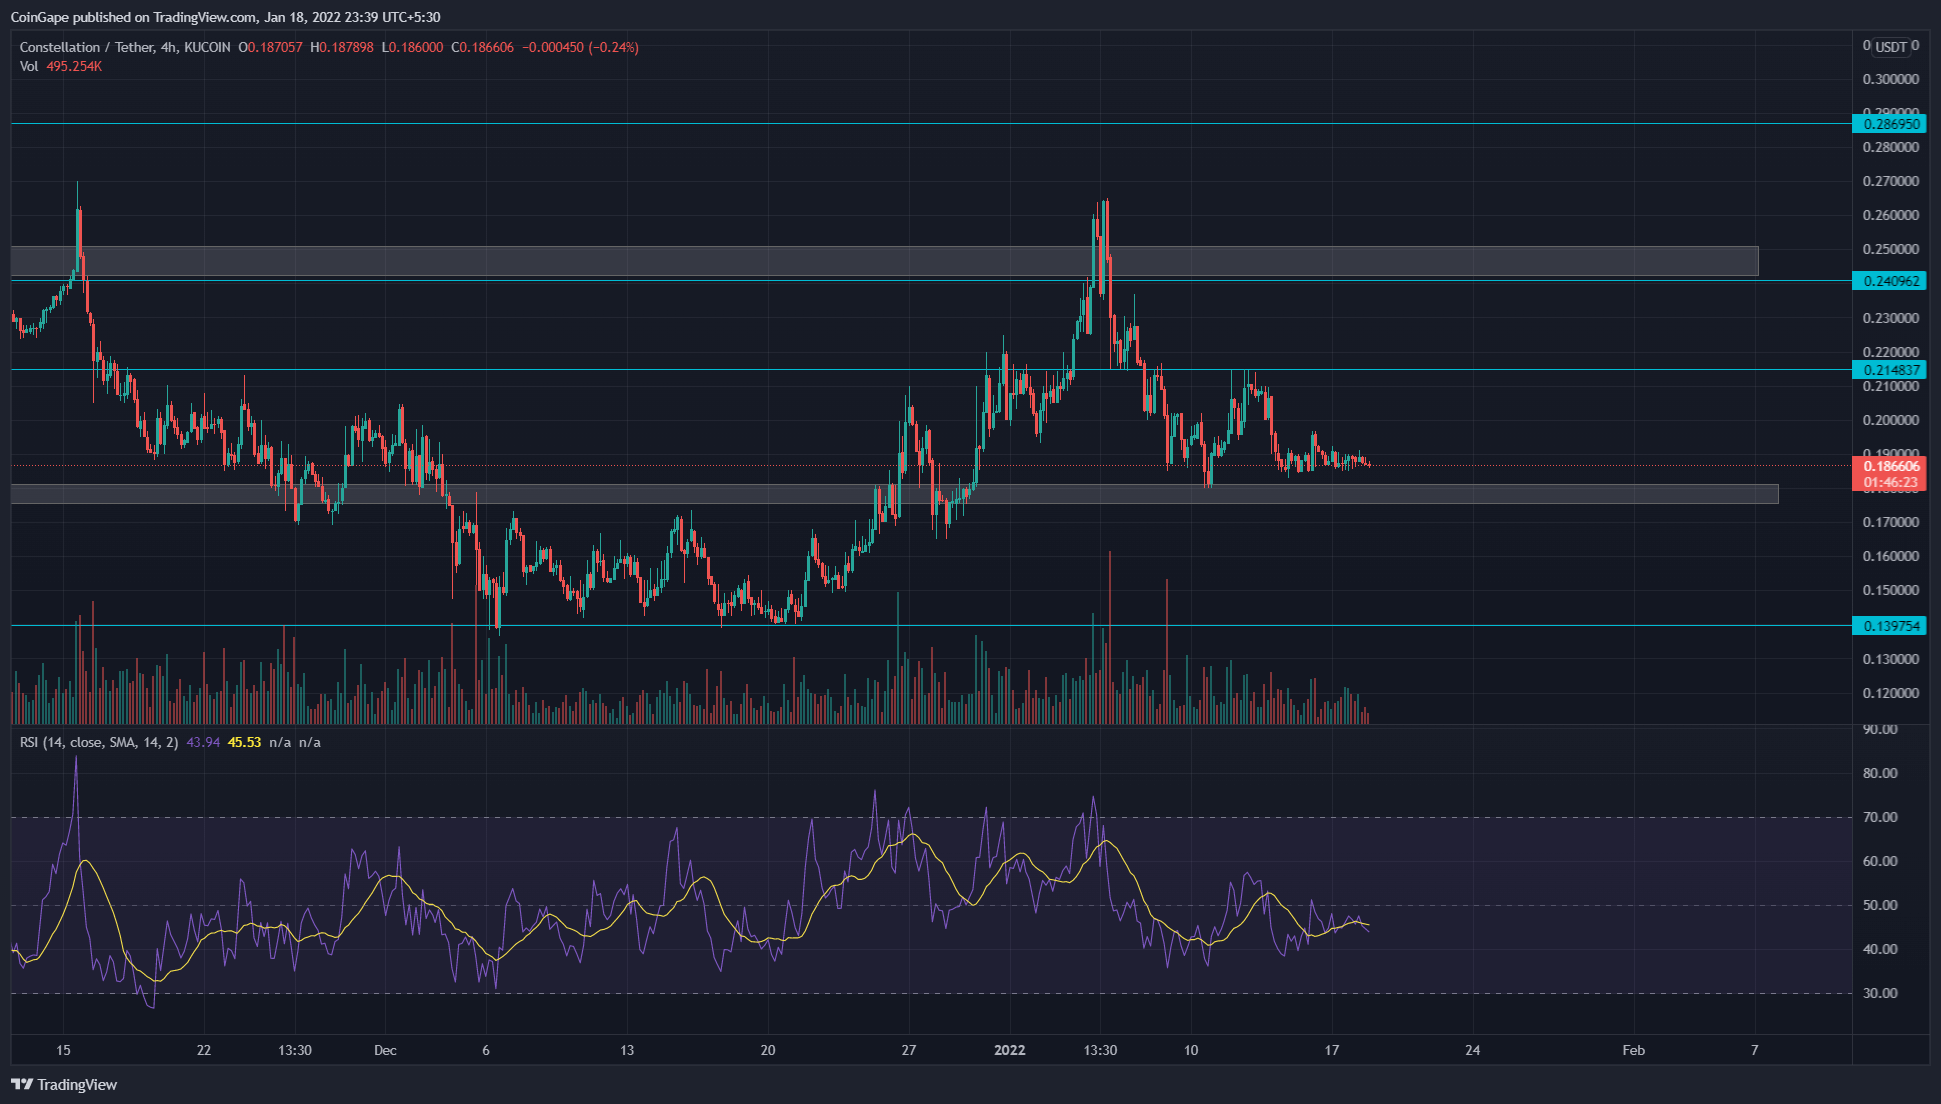
Rejecting from $0.24 resistance, the DAG price plummeted to the $0.18 support, losing around 23% in value. For almost two weeks, the coin price has been hovering above this support level, trying to acquire sufficient demand.
If DAG price manages to bounce back from this $0.18, the coin buyers have to overcome the descending trendline too, in order to continue its rally.
By the press time, the currently DAG price is trading at $0.186, with an intraday loss of 1.27%. Moreover, the 24hr volume change is $1.4 Million, indicating an 11.52% loss. According to coinmarketcap, the token stands at #180 rank with its current market cap of $243.5 Billion(+1.26%).
Technical Analysis
The DAG price has again slipped below the 200 DMA line, indicating a bearish trend. Combining with the $0.18 horizontal level, the 50 DMA line is trying to maintain a recovery rally.
The Moving average convergence divergence shows the MACD and signal line is constantly approaching the neutral zone(0.00)from above. If the DAG price breaks down from the $0.18 support, these lines will cross below the midline, providing an extra confirmation for the selling opportunity.
The 4-hour RSI chart displays bullish divergence, indicating a better possibility of bullish reversal.
- Resistance levels- $0.24 and $0.287
- Support levels- $0.18 and $0.14
Why Trust CoinGape
CoinGape has covered the cryptocurrency industry since 2017, aiming to provide informative insights Read more…to our readers. Our journal analysts bring years of experience in market analysis and blockchain technology to ensure factual accuracy and balanced reporting. By following our Editorial Policy, our writers verify every source, fact-check each story, rely on reputable sources, and attribute quotes and media correctly. We also follow a rigorous Review Methodology when evaluating exchanges and tools. From emerging blockchain projects and coin launches to industry events and technical developments, we cover all facets of the digital asset space with unwavering commitment to timely, relevant information.
Related Articles


- New $2M Funding Reveals Ethereum Foundation’s New Threat
- U.S. Shutdown Odds Hit 78% as CLARITY Act Faces Fresh Uncertainty
- Bitcoin Sentiment Weakens BTC ETFs Lose $103M- Is A Crash Imminent?
- Trump Backed Rick Rieder Now Leads the Odds for New Fed Chair
- Trump Threatens 100% Canada Tariffs as Bitcoin Holds $89K
- PEPE vs PENGUIN: Can Pengu Price Outperform Pepe Coin in 2026?
- Binance Coin Price Outlook As Grayscale Files S-1 for BNB
- Solana Price Prediction as SOL ETF Inflows Outpace BTC and ETH Together
- Bitcoin and Gold Outlook 2026: Warsh, Rieder Gain Traction in Trump’s Fed Pick
- PEPE Coin Price Eyes 45% Rebound as Buyers Regain Control on Spot Markets
- Pi Network Price Prediction: Will PI Coin Hold Steady at $0.18 Retrace Lower?


