Cryptocurrency Price Today: THETA, LUNA, STX Top Gainers in Last 24 Hrs As Fear Grips Rest Crypto Market


Amid the bearish cloud hovering above the crypto market, few coins are still turning green, contributing to their bullish motives. Let’s study the technical chart of these coins and see what trading opportunities they could provide.
-
THETA Price Chart: Bullish RSI Divergence Could Trigger Double Bottom Pattern
 Source-Tradingview
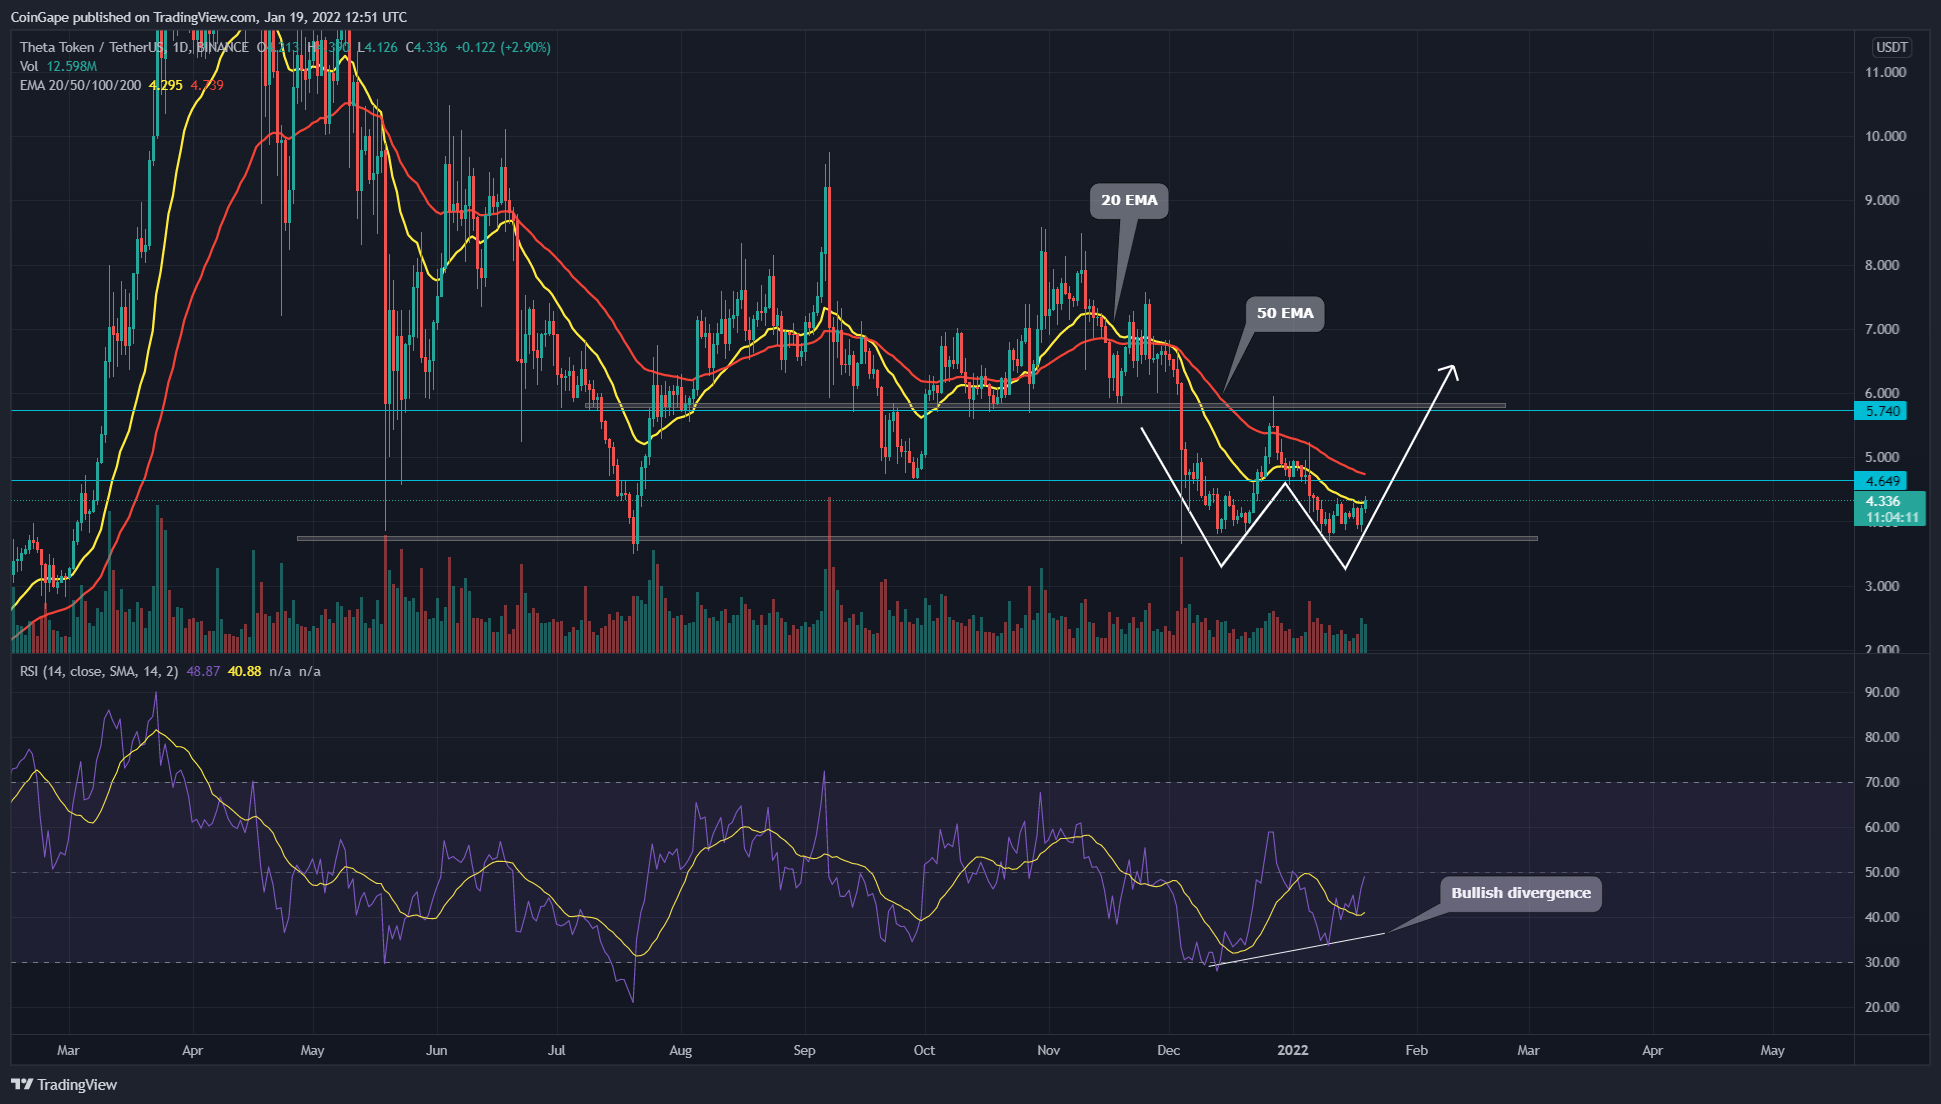
Since the beginning of the year 2022, the THETA coin has been under the strong bearish influence. The coin price rejected from the $5.8 mark completely wiped out all the gain bulls rather during the last month’s recovery and dropped to the bottom of $3.7.
However, this 30% discount in THETA price has attracted more buyers in this coin, as the technical chart shows reversal signs from the $3.7 support.
- This current recovery has so far engulfed the 20-day EMA line. However, the other crucial EMAs(50, 100, and 200) could provide strong resistance to a bullish rally.
- This daily-RSI(49) slope is on the verge of crossing above the neutral line. Moreover, the bullish divergence in the RSI chart hints at a better possibility to bounce back and form a double bottom pattern.
- Following this pattern, the price could rally to the $5.7 neckline, whose breakout would provide an excellent long opportunity to crypto traders.
-
LUNA Price Chart Shows Demand Pressure From The $78.3 Support
 Source- Tradingview
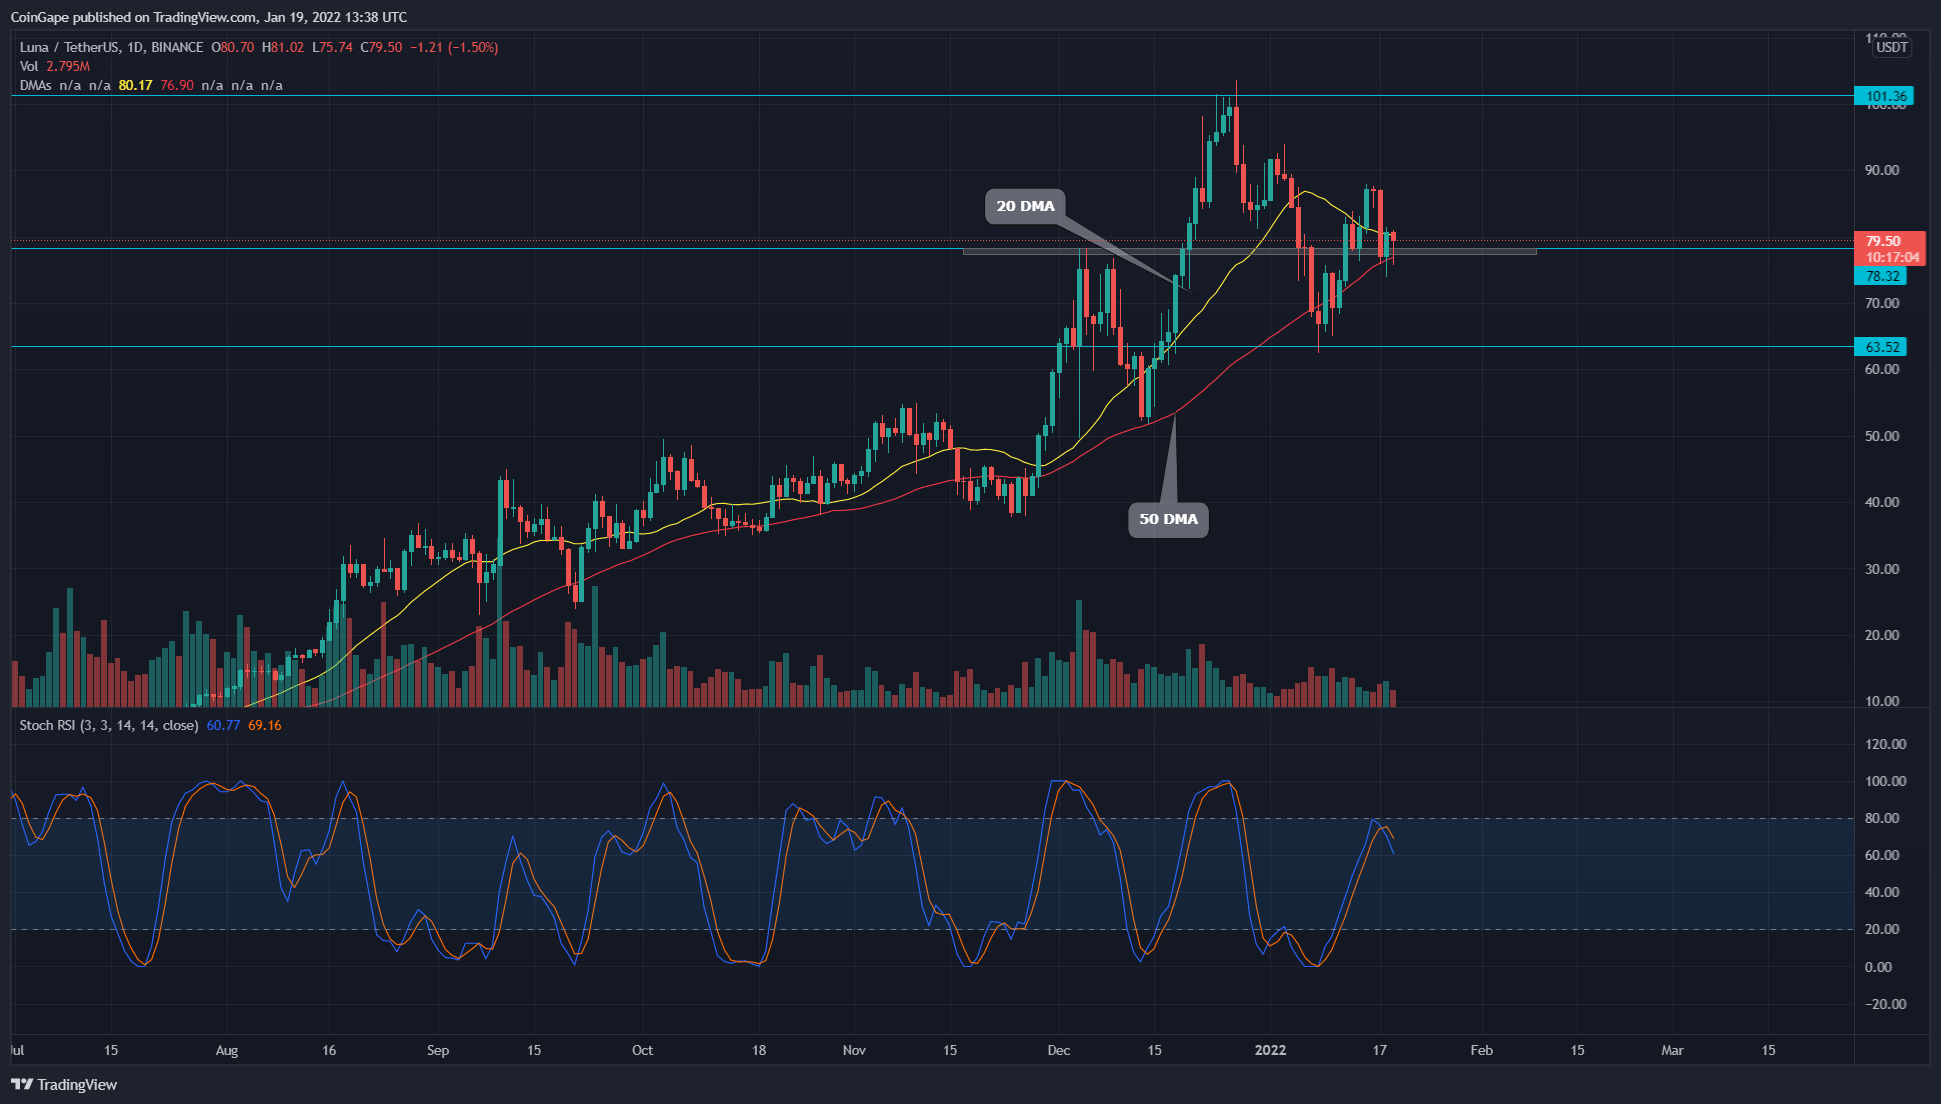
Previously when we covered an article on Terra coin, the LUNA/USD pair bounced from the $0.382 Fibonacci retracement level and initiated a new recovery rally. The price continued to rise higher and has recently reclaimed a higher resistance level of $78.3.
- From the past week, the price has been under a retest phase, trying to obtain sufficient support from the new flipped support($78.3). The current lower price rejection candles at this support hint at the presence of demand, which could lead the price to the All-Time High of $101
- Along with the $78.3 level, the LUNA coin price is also trying to hold above the 20 EMA line. However, the chart shows the 50 and 100 DMA lines can provide strong support during the moderate pullbacks.
- Under the influence of retest reversal, the daily-Stochastic RSI indicator slope shows a bearish crossover between the K and D lines. However, these lines moving around the 70% mark indicates an overall bullish sentiment.
-
STX Price Could Plunge To $1.8 Support
 Source- Tradingview
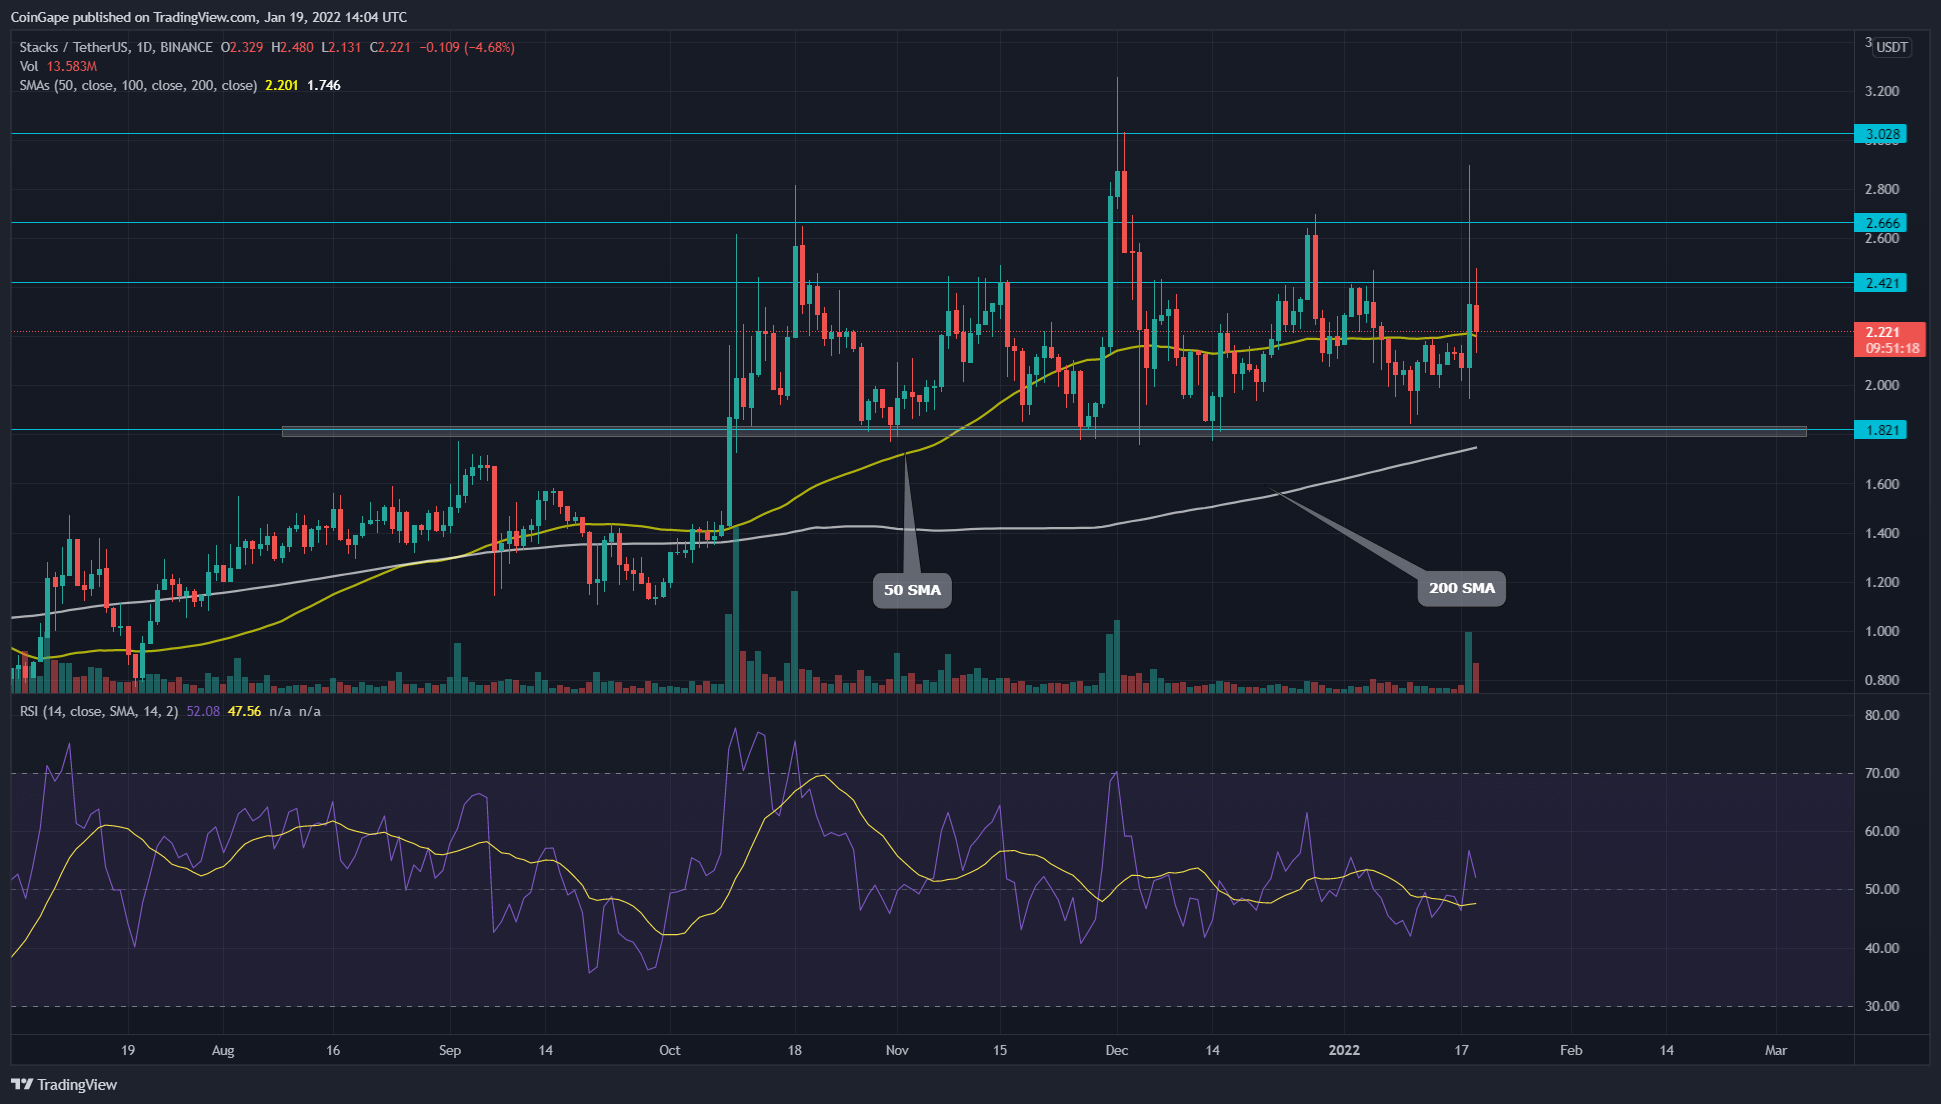
For the last three months, the $1.8 mark has been a crucial support level for STX price. The technical chart showed several retests of this bottom level all getting bounced back by significant gains.
- On January 10th, the price bounced from the $1.8 mark to initiate a new recovery rally. However, the coin couldn’t surpass the $2.4 resistance due to the strong selling pressure, which resulted in long higher rejection candles, indicating a bearish reversal.
- The STX coin price might drop back to the $1.8 support to regain its bullish momentum.
- Due to a sideways rally in STX price, the longer EMA lines have started to flatten. However, the coin price is still trading above the crucial EMAs(20, 50, 100, and 200), indicating a bullish trend.

Why Trust CoinGape
CoinGape has covered the cryptocurrency industry since 2017, aiming to provide informative insights Read more…to our readers. Our journal analysts bring years of experience in market analysis and blockchain technology to ensure factual accuracy and balanced reporting. By following our Editorial Policy, our writers verify every source, fact-check each story, rely on reputable sources, and attribute quotes and media correctly. We also follow a rigorous Review Methodology when evaluating exchanges and tools. From emerging blockchain projects and coin launches to industry events and technical developments, we cover all facets of the digital asset space with unwavering commitment to timely, relevant information.
Related Articles


- Will Bitcoin Crash Again as ‘Trump Insider’ Whale Dumps 6,599 BTC
- XRP News: Ripple’s RLUSD Gets Boost as CFTC Expands Approved Tokenized Collateral
- Crypto Markets Brace as Another Partial U.S. Government Shutdown Looms Next Week
- $40B Bitcoin Airdrop Error: Bithumb to Reimburse Customer Losses After BTC Crash To $55k
- ETH Price Fears Major Crash As Trend Research Deposits $1.8B Ethereum to Binance
- Cardano Price Prediction as Midnight Token Soars 15%
- Bitcoin and XRP Price Outlook Ahead of Crypto Market Bill Nearing Key Phase on Feb 10th
- Bitcoin Price Prediction as Funding Rate Tumbles Ahead of $2.1B Options Expiry
- Ethereum Price Outlook as Vitalik Buterin Sells $14 Million Worth of ETH: What’s Next for Ether?
- Solana Price at Risk of Crashing Below $50 as Crypto Fear and Greed Index Plunges to 5
- Pi Network Price Prediction Ahead of PI KYC Validator Reward System Launch


