Decentraland (MANA) Price Prediction: MANA Bounces 200 EMA AT $2.37, Looks For 60% Upside


Decentraland (MANA) price has broken its long-term downward spell on Tuesday. Amid a recovery rally, the gains were carried on Wednesday also. Improved risk sentiment after modest initial sections by Western nations on Moscow helped riskier assets to hold some ground.
- Decentraland price edges higher on Wednesday.
- Price moves inside rising wedge pattern to take make 60% upside risk.
- A breakdown of the $2.37 support level could prove bulls wrong.
At the time of writing, MANA/USD is trading at $2.69, up 1.85% for the day. The 16th largest cryptocurrency by market cap held 24-hour trading volume of $965,542,595 as per the CoinMarketCap.
MANA looks for another leg up
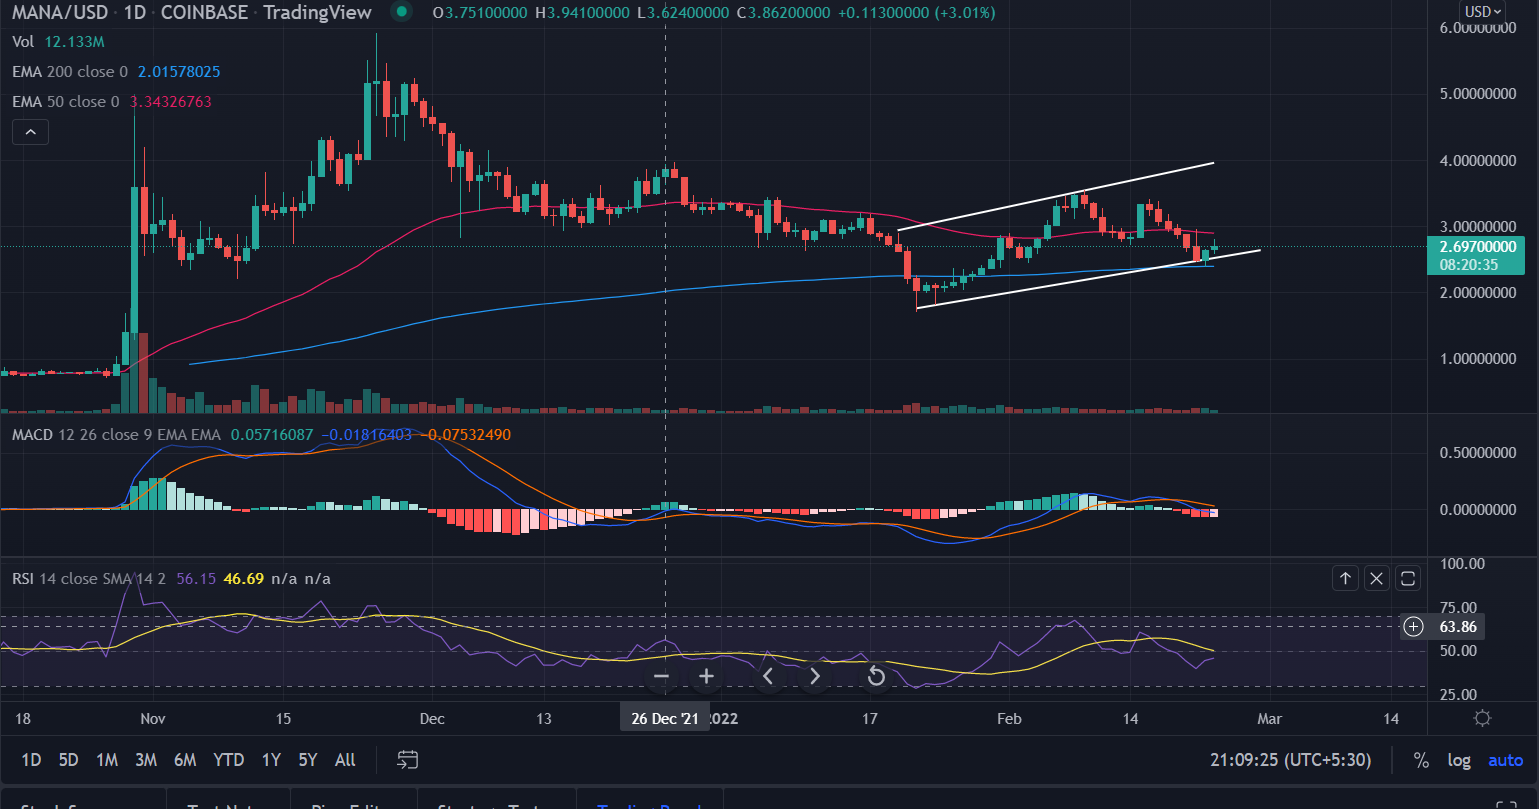
On the daily chart, Decentraland (MANA) has observed an ascent of 108% from the lows of January 22 at $1.71. The current price action has multiple hurdles and investors met the supply zone near $3.39 and is currently looking for a new leg up.
As the price moves inside the ‘rising wedge pattern, which is a bearish continuation pattern could see a new rally be on its way, firstly MANA must surpass the 50-day EMA (Exponential Moving Average) at $2.90.
Anticipating the Decentraland price continues to ascend from the current levels, it could climb nearly 20% before meeting the upside filter at $3.90.
On the flip side, a breakdown of the $2.40 support level that coincides with the rising trend line of the rising wedge formation will suggest that the buyers are unable or unwilling to participate further. Furthermore, a daily candlestick close below $2.03 will invalidate the bullish thesis.
In this scenario, MANA could crash lower, retesting the $1.70 barrier.
Technical indicators:
RSI: The Daily Relative Strength Index (RSI) reads at 45 below the moving average line.
MACD: The Moving Average Convergence Divergence (MACD) falls below the mid line with a bearish bias.

Why Trust CoinGape
CoinGape has covered the cryptocurrency industry since 2017, aiming to provide informative insights Read more…to our readers. Our journal analysts bring years of experience in market analysis and blockchain technology to ensure factual accuracy and balanced reporting. By following our Editorial Policy, our writers verify every source, fact-check each story, rely on reputable sources, and attribute quotes and media correctly. We also follow a rigorous Review Methodology when evaluating exchanges and tools. From emerging blockchain projects and coin launches to industry events and technical developments, we cover all facets of the digital asset space with unwavering commitment to timely, relevant information.

Related Articles


- What Will Spark the Next Bitcoin Bull Market? Bitwise CIO Names 4 Factors
- U.S. CPI Release: Wall Street Predicts Soft Inflation Reading as Crypto Market Holds Steady
- Bhutan Government Cuts Bitcoin Holdings as Standard Chartered Predicts BTC Price Crash To $50k
- XRP News: Binance Integrates Ripple’s RLUSD on XRPL After Ethereum Listing
- Breaking: SUI Price Rebounds 7% as Grayscale Amends S-1 for Sui ETF
- Solana Price Prediction as $2.6 Trillion Citi Expands Tokenized Products to SOL
- Bitcoin Price Could Fall to $50,000, Standard Chartered Says — Is a Crash Coming?
- Cardano Price Prediction Ahead of Midnight Mainnet Launch
- Pi Network Price Prediction as Mainnet Upgrade Deadline Nears on Feb 15
- XRP Price Outlook Amid XRP Community Day 2026
- Ethereum Price at Risk of a 30% Crash as Futures Open Interest Dive During the Crypto Winter


