Decentraland Price Analysis: Declining Volumes Warns Of Correction; Are You Holding?


The Decentraland price analysis indicates a sideways trend with a bearish sentiment. The upside rally lost its steam near the $1.10-$1.20 resistance zone. It is a six-month-old resistance zone, which remains a hard nut to crack for the bulls. Multiple candles near the mentioned level show the rejection.
The MANA token is trading in a very narrow trading range extending the previous session’s sell-off. The price meets the selling pressure near the supply zone. Currently, the token is hovering near the critical support zone on the daily chart.
As of writing, MANA/USD is trading at $0.97, up 0.99% for the day. The 24-hour trading volume fell more than 15% to $1,47,210,146.
- Decentraland price trade with modest gains on Thursday.
- Horizontal support near $0.98 acted as a crucial barricade for a deep fall.
- A break below $0.98 would intensify the selling pressure on the token.
Decentraland price looks submissive
The Decentraland price analysis reflects the sellers are taking control
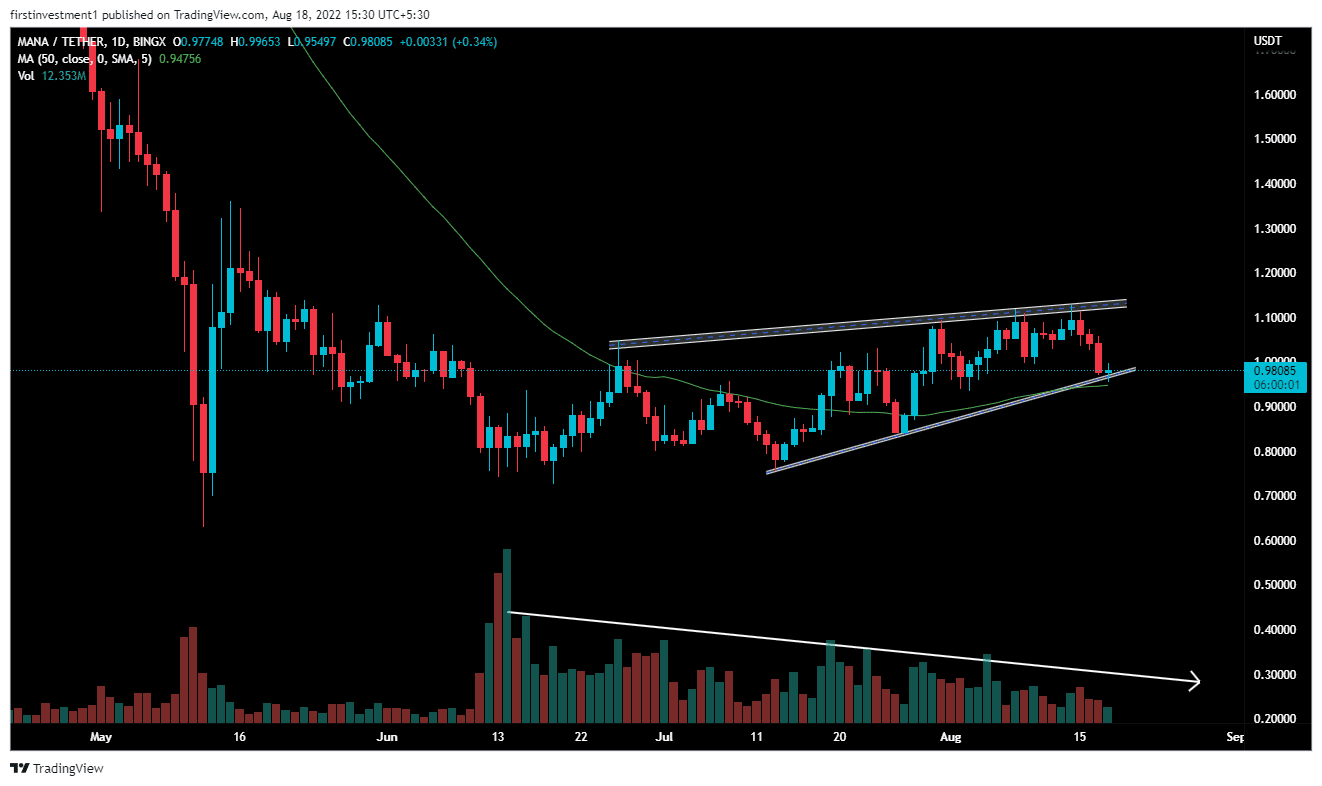
On the daily chart, MANA is trading in a “Rising Wedge” pattern. A rising wedge is generally a bearish signal as it indicates a possible reversal during an uptrend.
The volumes are declining, with the rising price of a MANA, which implies a decreasing interest in creating long positions. When the market is rising while volume is declining, it might mean that the big players are not buying, more likely slowly exiting positions.
The price is recently supporting the 20-day exponential moving average, along with a support line connecting all previous lows. If that occurs the price could further drop toward $0.940. It will add to the bearish sentiment.
Next, the MANA sellers could look for a fresh selling opportunity at the low of July 26 at $0.84.
The nearest support of MANA is between $0.93 to $0.96, whereas the most immediate resistance is found around $1.04. There is a higher probability of a price-breaking support zone.
On the flip side, a daily candlestick above $1.01 would deter any bearish sentiment.
4-hour chart echos bearish frequency
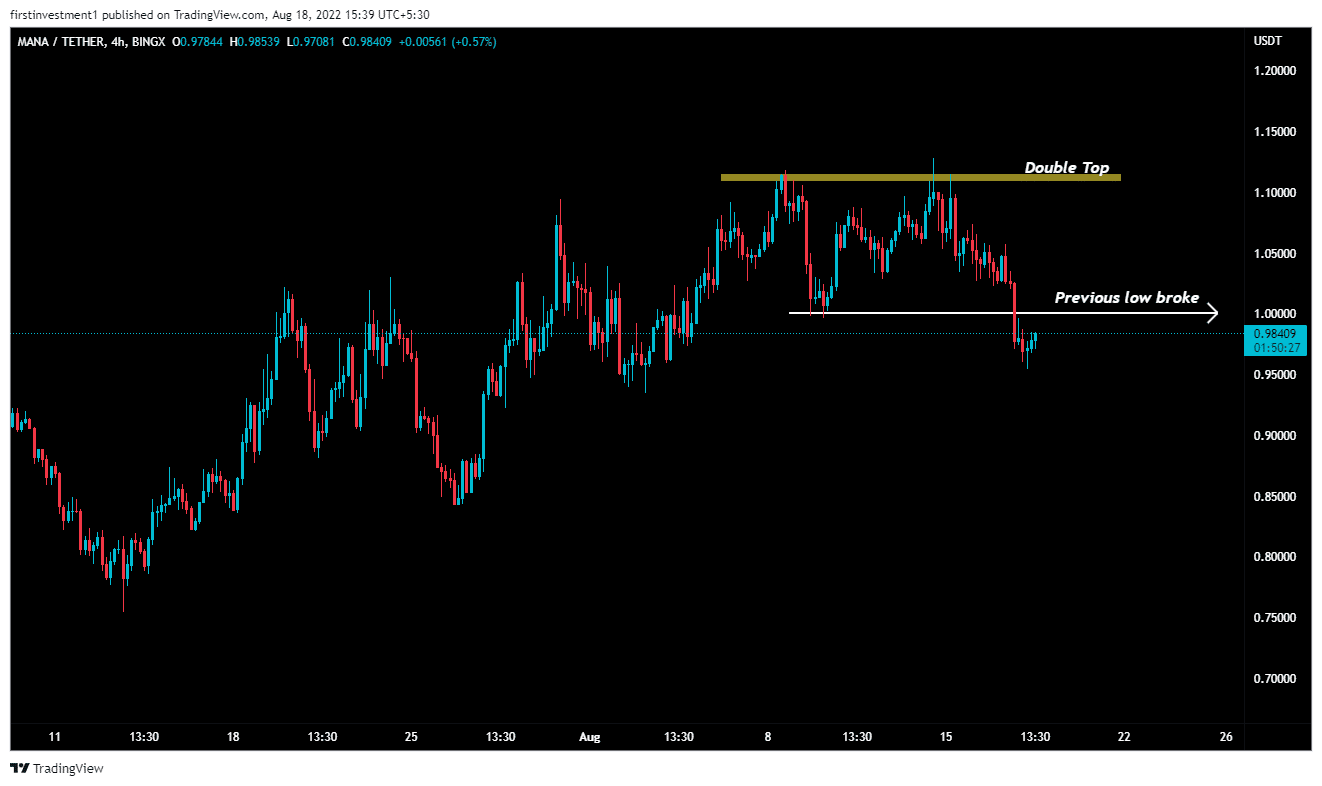
In the four-hour time frame, the price made higher highs and higher lows, but recently, the trend has changed from bullish to bearish.
Also read: https://Largest Investment Bank in LatAm Starts Offering Crypto Brokerage Services
Near the higher levels, MANA made a “Double Top” pattern and even broke the previous swing low. This provides a “Sell on rising” opportunity for investors.
On the other hand, a break above the $1.02 level could invalidate the bearish outlook. And the price can be above $1.110
MANA is bearish on all time frames. Below $0.94 closing on the hourly time frame, we can put a trade on the sell side.

Why Trust CoinGape
CoinGape has covered the cryptocurrency industry since 2017, aiming to provide informative insights Read more…to our readers. Our journal analysts bring years of experience in market analysis and blockchain technology to ensure factual accuracy and balanced reporting. By following our Editorial Policy, our writers verify every source, fact-check each story, rely on reputable sources, and attribute quotes and media correctly. We also follow a rigorous Review Methodology when evaluating exchanges and tools. From emerging blockchain projects and coin launches to industry events and technical developments, we cover all facets of the digital asset space with unwavering commitment to timely, relevant information.

Related Articles


- Bitcoin ETF Update: BlackRock Signals BTC Sell-Off as Kevin O’Leary Warns of Decline In Institutional Demand
- Breaking: Tom Lee’s BitMine Buys 45,759 ETH as CryptoQuant Flags Potential Bottom For Ethereum
- Breaking: U.S. CFTC Moves To Defend Polymarket, Kalshi From Regulatory Crackdown By State Regulators
- Breaking: Michael Saylor’s Strategy Adds 2,486 BTC Amid Institutional Concerns Over Quantum Threat To Bitcoin
- Ripple CEO Hints Crypto Bill Is Near Deal, Sets April as Approval Timeline
- 5 Things Dogecoin Price Needs to Hit $0.20 in Feb 2026
- Bitcoin Price Prediction as Experts Warns of Quantum Risks
- Dogecoin, Shiba Inu, Pepe Coin Price Predictions As BTC Crashes Below $68k
- Ethereum Price Outlook as Harvard Shifts Focus from Bitcoin to ETH ETF
- HOOD and COIN Stock Price Forecast as Expert Predicts Bitcoin Price Crash to $10k
- XRP Price Prediction Ahead of Supreme Court Trump Tariff Ruling


