Decentraland Price Analysis: MANA Consolidates Near $1.05; Are You Buying It?


Decentraland price analysis indicates an extended consolidation. However, the bias still remains positive. On the daily time frame, the MANA is in an uptrend after breaking an important supply zone near $0.9405. Few candlesticks need to close above the current level to continue to move higher.
As of publication time, MANA/USD is trading at $1.050, down 0.26% for the day. The 24-hour trading volume fell more than 28% to $139,676,898 according to CoinMarketCap data. A fall in the price with descending volume pattern indicates a weakening downside trend.
- Decentraland price fell for the second consecutive session on Saturday.
- Two red candles formed inside a green candlestick made on Thursday show bulls are not out of action.
- A daily candlestick above $1.065 would make further gains in the coin.
MANA price waits for the next signal
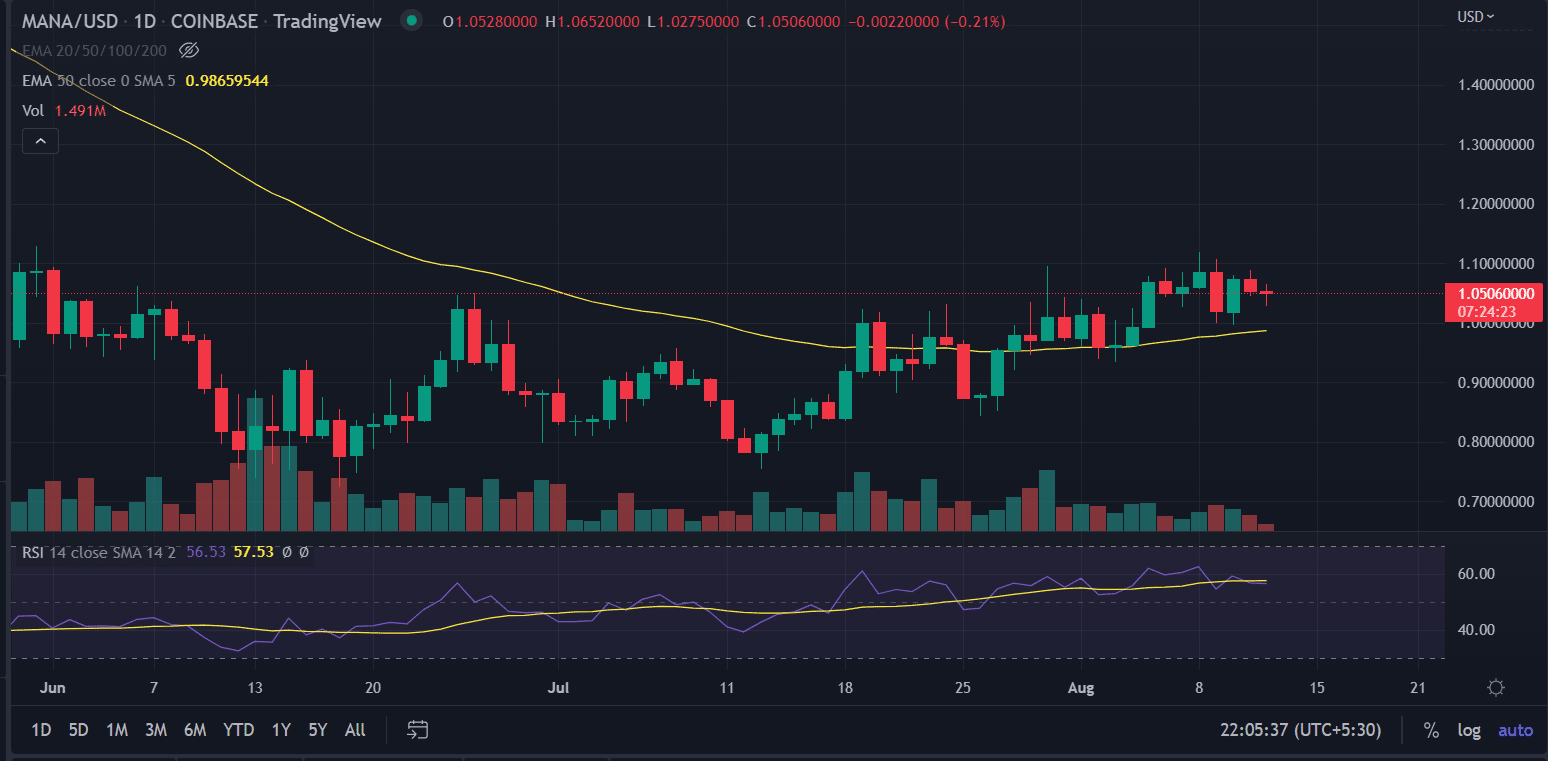
On the daily chart, the MANA price is bullish, making higher highs and higher lows. The MANA bulls are attempting to flip support into resistance. The price breached the critical 50-day exponential moving average (EMA) at $0.947. Since April MANA is trading below the moving average.
The formation of a Doji candlestick suggests indecision among investors. However, a renewed buying pressure could push the price higher. A daily candlestick above the session’s high would make bulls hopeful. In that case, the bulls would aim for the psychological $1.20 level.
The overall volume levels usually declined with the price consolidation. Volume sometimes increases near the highs, as shown in the charts. After the third high, an expansion of volume on the subsequent decline and at the support break greatly reinforces the soundness of the pattern.
Also read: https://coingape.com/eth-whale-adds-312-billion-shiba-inu-tokens-amid-price-dip/
The volumes are trading below average for the past 3 weeks, along with price trading in a range or slightly uptrend. If the price doesn’t be able to close above $1.05 in a few sessions, MANA would enter into a downtrend.
If the price fall below the 50-day exponential moving average, then we can put a sell trade with the expected fall of up to $0.802.
The major concern is the price contraction near the resistance level, as well as the long range of consolidation at exact same level. Indicating weak resistance in near future.
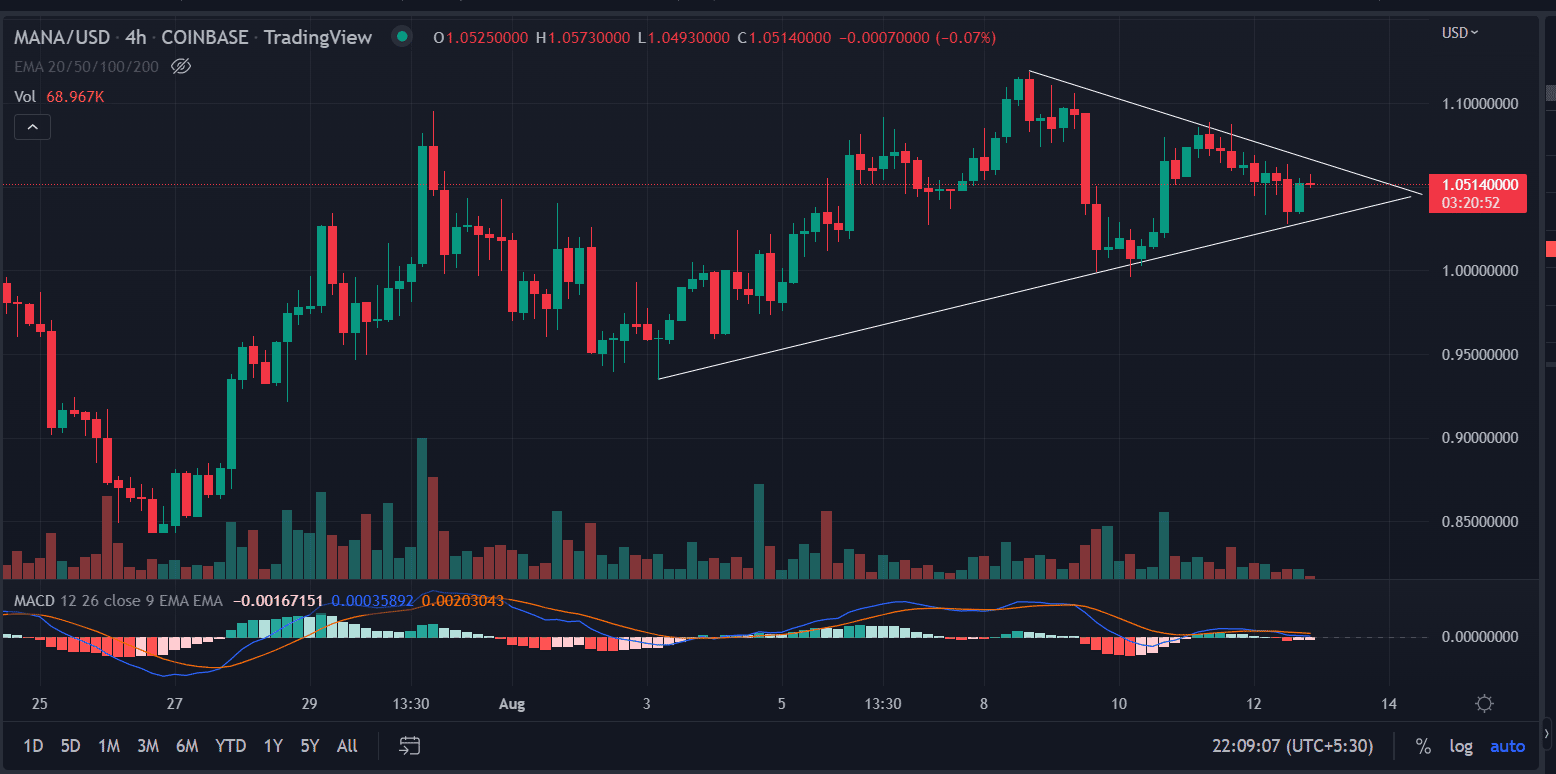
On the four-hour chart, the price formed a symmetrical triangle formation. The price is about to break the convergence of the upper and lower trend line. Additional buying pressure could break the upper trend line at $1.075. The price could test August 8 high at $1.11.
On the other hand, a break below the $1.28 level could invalidate the bullish outlook. And the price can fall toward $0.996.

Why Trust CoinGape
CoinGape has covered the cryptocurrency industry since 2017, aiming to provide informative insights Read more…to our readers. Our journal analysts bring years of experience in market analysis and blockchain technology to ensure factual accuracy and balanced reporting. By following our Editorial Policy, our writers verify every source, fact-check each story, rely on reputable sources, and attribute quotes and media correctly. We also follow a rigorous Review Methodology when evaluating exchanges and tools. From emerging blockchain projects and coin launches to industry events and technical developments, we cover all facets of the digital asset space with unwavering commitment to timely, relevant information.

Related Articles


- Bitcoin ETF Update: BlackRock Signals BTC Sell-Off as Kevin O’Leary Warns of Decline In Institutional Demand
- Breaking: Tom Lee’s BitMine Buys 45,759 ETH as CryptoQuant Flags Potential Bottom For Ethereum
- Breaking: U.S. CFTC Moves To Defend Polymarket, Kalshi From Regulatory Crackdown By State Regulators
- Breaking: Michael Saylor’s Strategy Adds 2,486 BTC Amid Institutional Concerns Over Quantum Threat To Bitcoin
- Ripple CEO Hints Crypto Bill Is Near Deal, Sets April as Approval Timeline
- 5 Things Dogecoin Price Needs to Hit $0.20 in Feb 2026
- Bitcoin Price Prediction as Experts Warns of Quantum Risks
- Dogecoin, Shiba Inu, Pepe Coin Price Predictions As BTC Crashes Below $68k
- Ethereum Price Outlook as Harvard Shifts Focus from Bitcoin to ETH ETF
- HOOD and COIN Stock Price Forecast as Expert Predicts Bitcoin Price Crash to $10k
- XRP Price Prediction Ahead of Supreme Court Trump Tariff Ruling


