
Ethereum (ETH) Fell 25% From Swing High; Is Correction over?


Ethereum (ETH) price analysis shows an extended consolidation. ETH tested one month low below $1,500 on Saturday. The price is trading in red for the past few hours.
As of publication time, ETH/USD is trading at $1,503.67, down 0.31% for the day. The second largest cryptocurrency by the market cap holds the 24-hour trading volume with more than 40% gains at $25.21 billion.
- Ethereum price trades lower extending the previous session’s loss.
- A decisive break below $1,500 would bring more losses to the coin.
- This bearish formation on the weekly chart favors bears.
Ethereum price is in limbo
ETH price closed above $2000 for the first time since March 29, 2021, and since then the price had made a high of $4,867. However, the price broke the support of more than one year of $2000 on May 22, 2022, & tested the all-time low of $898.
Finally, the price tested the $2000 level again in the previous week, but couldn’t sustain above the level as it faces heavy resistance, which was once acting as a support.
Further, ETH faces pressure near the 20-day exponential moving average. Along with a 38.6% Fibonacci retracement, which will act as immediate resistance for this week.
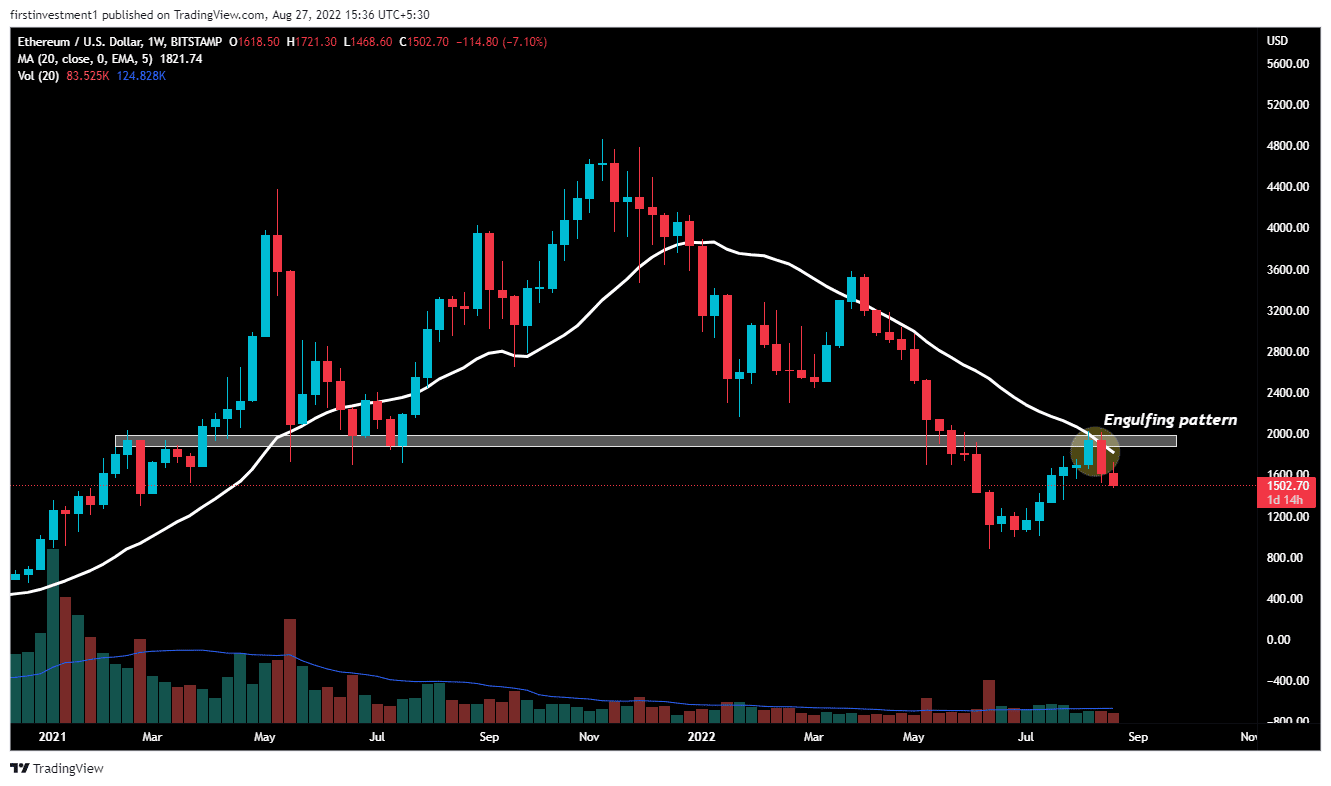
A bearish engulfing pattern on the weekly chart favors the bearishness. A bearish engulfing pattern produces the strongest signal when it appears at the tip of an uptrend. During this pattern, the red candle engulfs the previous (smaller) green candle & appears at the highest of an uptrend.
Since bearish engulfing candles can indicate the start of a chronic downtrend, it’s helpful to contemplate an initial take profit level while remaining hospitable to further downward movement. Adjust stops accordingly or think about employing a trailing stop.
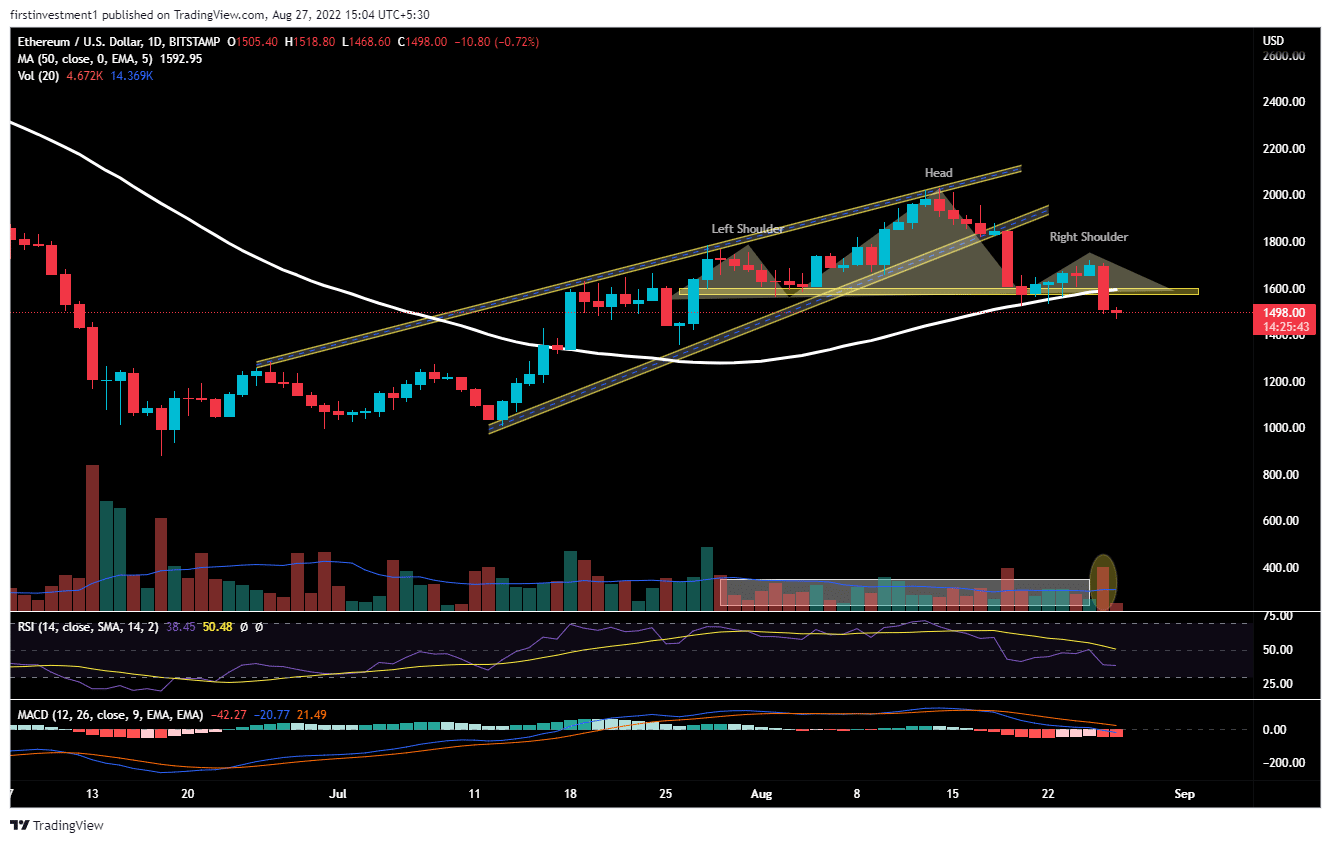
On the daily chart, the Ethereum price has given a breakdown of a “Rising Wedge” pattern on August 18, indicating weakness around the overall look. After making lower highs and lower lows, ETH even slipped below the 50-day exponential moving average in the previous session.
In addition, a breakdown of a “Head & Shoulder” pattern, with rising volumes compared to previous average volumes hints at more weakness in the coin. The neckline of support is at $1,565. If the price sustains below this given level, then there is a higher chance of ETH moving toward $1,400.
The RSI (14) is trading below 50. Another momentum oscillator, the MACD line crosses below the signal line below zero, indicating a bearish trend.
The nearest support is $1,477, whereas the nearest resistance is $1,575. There is a higher probability of the price to breaks its support level. “Sell on rising” opportunity is the best course of plan we can go with.
On the other hand, a weekly move above the $1,575 level could invalidate the bearish outlook. And the price can be higher than $1,700.
ETH is bearish on all time frames. Below $1,477 closing on the hourly time frame, we can put a trade on the sell side.
Play 10,000+ Casino Games at BC Game with Ease
- Instant Deposits And Withdrawals
- Crypto Casino And Sports Betting
- Exclusive Bonuses And Rewards


Why Trust CoinGape
CoinGape has covered the cryptocurrency industry since 2017, aiming to provide informative insights Read more…to our readers. Our journal analysts bring years of experience in market analysis and blockchain technology to ensure factual accuracy and balanced reporting. By following our Editorial Policy, our writers verify every source, fact-check each story, rely on reputable sources, and attribute quotes and media correctly. We also follow a rigorous Review Methodology when evaluating exchanges and tools. From emerging blockchain projects and coin launches to industry events and technical developments, we cover all facets of the digital asset space with unwavering commitment to timely, relevant information.


- CLARITY Act Negotiations Progress As Senators Meet With Trump’s Crypto Advisor
- Crypto Market Under Pressure as Traders Price Out Fed Rate Cuts Over Inflation Risks
- U.S.-Iran War: Iran Strikes Haifa Oil Refinery, Trump Urges Israel’s Restraint
- Bitcoin Crashes Below $70K as Analysts Warn Oil Could Hit $200 Amid U.S.-Iran Conflict
- Crypto Alert: Binance to Delist These Eight Tokens on April 1
- Cardano (ADA) Price Prediction Amid SEC/CFTC Policy Shift and ETF Update
- Crypto Stock to Watch As Bitcoin Price Crashed Below $70k; CRCL, COIN, MSTR, HOOD
- Why Is XRP Price Crashing Today (March 19th)
- Pi Network Price Forecast After PI Mainnet Upgrades To Protocol 20
- Will Bitcoin Price Hold $70K After Fed Reserve Keeps Rates Unchanged for 2nd Consecutive Meeting?
- Gold Price Crashed After U.S. Core PPI Came In Higher Than Expected.


