Ethereum Price Analysis: Can $1000 Support Drive ETH Price Higher?


June’s second week-sell off plunged the ETH/USDT pair to a low of $896.1. However, the high demand pressure prevented a daily candle from closing below the $1000 support, resulting in long-tail rejection. Nevertheless, if buyers could sustain above the psychological support, the price may witness a minor relief rally.
Key points:
- The ETH price has been losing for straight eleven weeks
- The coin chart shows demand pressure near $1000
- The intraday trading volume in the Ethereum is $27.3 Billion, indicating a 3.2% gain
 Source- Tradingview
From Mid-April to June, the Ethereum(ETH) price slowed its downfall as the broader market witnessed uncertainty among the market participants. Furthermore, The buyers were trying to sustain the price above $1700, which resulted in a minor consolidation.
However, submitting to the last week’s crypto crash, the ETH breached $1700 support on June 10th. The post-retest fall tumbled the altcoin by 41% and sank it to $1000 psychological support. On June 18th, the sellers tried to break this crucial support, but despite being backed by high volume, the daily candlestick reverted with a long-lower price rejection.
Today with another failed attempt to sustain below the $1000, the ETH price is up 4.5%. Thus, this psychological support indicates high demand pressure and could trigger a minor relief rally.
The replenished bullish momentum may drive a bullish pullback to $1400 or $1700.
Alternatively, the daily candlestick closing below the $1000 support would invalidate the bullish theory.
Ethereum(ETH) Global In/Out of the Money
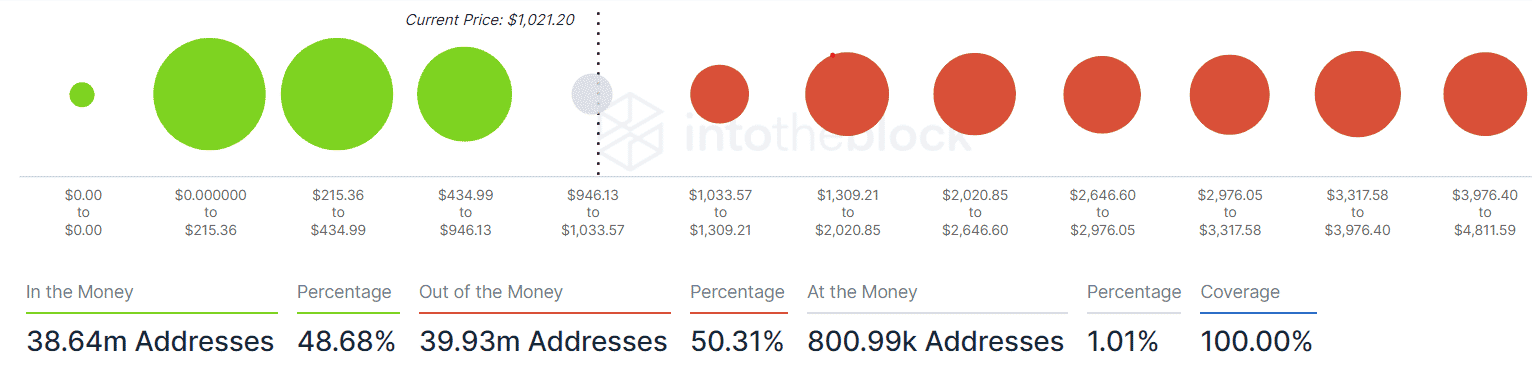
Source- intotheblock
The Onchain GIOM metric indicates that 50.3% of Ethereum addresses are witnessing losses while 48.68% of addresses are in profit. This decreases the potential of investors holding their coins amid the bear market.
Moreover, the nearest green cluster suggests the $619 average as a potential demand zone. On the flip side, the two red cluster projects $1163 and $1750 as supply regions.
Technical indicator-
Relative Strength Index- The daily-RSI slope wavering in the oversold region encourages the recovery theory.
EMAs- The fast-moving 20-day EMA has provided constant resistance to ETH prices since April. A potential recovery needs to surpass this dynamic resistance to carry a genuine rally
- Resistance level- $1400, and $1700
- Support levels- $1000 and $800

Why Trust CoinGape
CoinGape has covered the cryptocurrency industry since 2017, aiming to provide informative insights Read more…to our readers. Our journal analysts bring years of experience in market analysis and blockchain technology to ensure factual accuracy and balanced reporting. By following our Editorial Policy, our writers verify every source, fact-check each story, rely on reputable sources, and attribute quotes and media correctly. We also follow a rigorous Review Methodology when evaluating exchanges and tools. From emerging blockchain projects and coin launches to industry events and technical developments, we cover all facets of the digital asset space with unwavering commitment to timely, relevant information.

Related Articles


- Jane Street and Abu Dhabi Wealth Fund Mubadala Increase Holdings In BlackRock’s Bitcoin ETF
- FOMC Minutes Drop Tomorrow: Will Crypto Market Rally or Face Fed Shock?
- BlackRock Amends Filing For Staked Ethereum ETF, Eyes 18% of Staking Rewards From ETH Fund
- Arizona Advances Bitcoin, XRP Reserve Bill Using Seized Crypto Assets
- Bitcoin ETF Update: BlackRock Signals BTC Sell-Off as Kevin O’Leary Warns of Decline In Institutional Demand
- Pi Network Price Beats Bitcoin, Ethereum, XRP as Upgrades and Potential CEX Listing Fuels Demand
- 5 Things Dogecoin Price Needs to Hit $0.20 in Feb 2026
- Bitcoin Price Prediction as Experts Warns of Quantum Risks
- Dogecoin, Shiba Inu, Pepe Coin Price Predictions As BTC Crashes Below $68k
- Ethereum Price Outlook as Harvard Shifts Focus from Bitcoin to ETH ETF
- HOOD and COIN Stock Price Forecast as Expert Predicts Bitcoin Price Crash to $10k


