Ethereum Price Breaks $1920 Support; Bull Trap or Reversal?


Amid the recent recovery in the crypto market, the Ethereum price gave a strong breakout from the monthly resistance of $1922. In the last four days, the buyers tried to sustain this level but witnessed today as the prices dropped below the breached level. This scenario creates a bull trap which is known to intensify selling pressure and plunge the asset price back to lower levels.
Also Read: Ethereum Births New Token Standard, Will This Reduce ETH Supply?
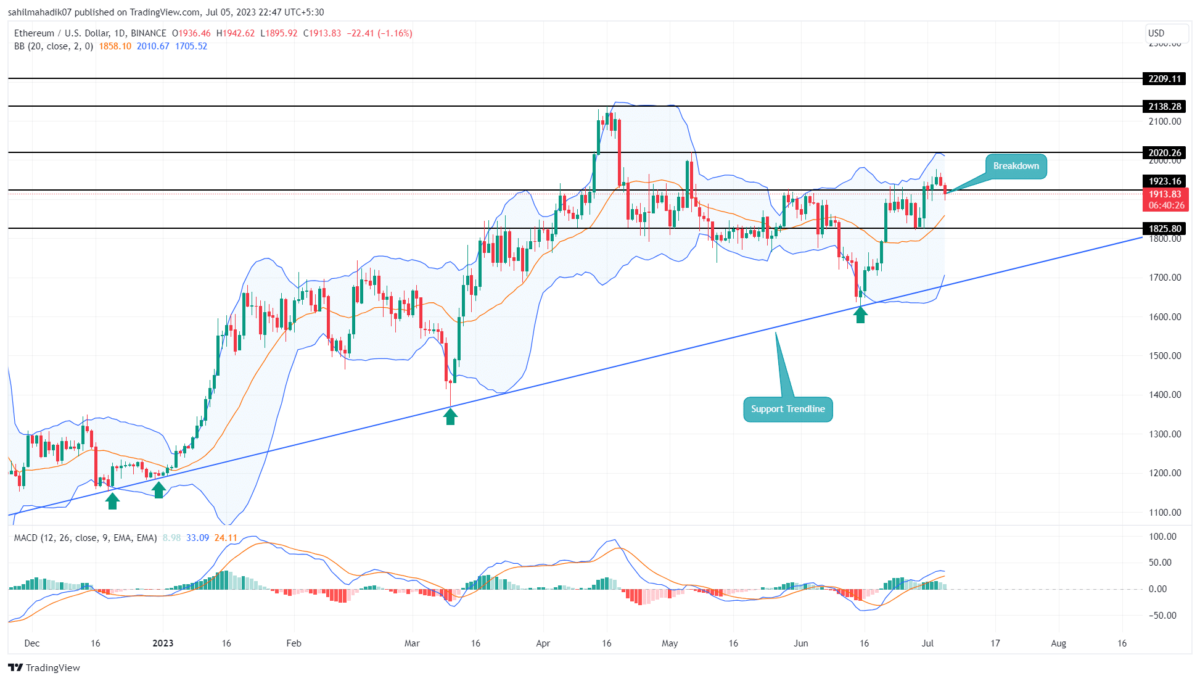
Ethereum Price Daily Chart
- A breakdown below the $1922 mark sets the ETH price for a quick 4.3% drop
- The Ethereum price could maintain a bullish outlook until the rising trendline is intact.
- The intraday trading volume in Ether is $6.9 Billion, indicating a 10% gain.
 Source- Tradingview
With an intraday loss of 1.75%, the Ethereum price showcased a breakdown below the $1922 flipped support. This breakdown undermined the buyer’s last weekend attempt to reclaim this level as a stepping stone to prolong this recovery.
By the press time, the ETH price trades at $1907, and if the daily candle closes below the $1900 mark, the sellers will gain significant confirmation to carry a downfall. With sustained selling, the aggressive buyers who entered $1922 may get liquidated and bring more selling orders.
The potential fall could tumble this altcoin’s value by 4.3% before hitting the next strong support at $1825.
On a contrary note, if the daily candle rise above the $1922 mark by the day’s end, the bearish thesis will be invalidated.
Has Ethereum Recovery Ended?
If the selling momentum rises and triggers a significant correction, the Ethereum price will revisit a long-coming support trendline. This dynamic support has maintained a steady recovery for the past seven months and offered suitable pullback support to accumulate at dips. Thus, until this trendline is intact, the ETH price may prolong an upward rally.
- Bollinger Band: A downtick in the upper band of Bollinger band indicators reflects the exhausted bullish momentum.
- Moving Average Convergence Divergence: The MACD(Blue) and signal(orange) line gradually closing towards a bearish crossover could increase beard trend sentiment among market participants.

Why Trust CoinGape
CoinGape has covered the cryptocurrency industry since 2017, aiming to provide informative insights Read more…to our readers. Our journal analysts bring years of experience in market analysis and blockchain technology to ensure factual accuracy and balanced reporting. By following our Editorial Policy, our writers verify every source, fact-check each story, rely on reputable sources, and attribute quotes and media correctly. We also follow a rigorous Review Methodology when evaluating exchanges and tools. From emerging blockchain projects and coin launches to industry events and technical developments, we cover all facets of the digital asset space with unwavering commitment to timely, relevant information.
Related Articles


- CLARITY Act: Bessent Slams Coinbase CEO, Calls for Compromise in White House Meeting Today
- Crypto Traders Reduce Fed Rate Cut Expectations Even as Expert Calls Fed Chair Nominee Kevin Warsh ‘Dovish’
- Crypto, Banks Clash Over Fed’s Proposed ‘Skinny’ Accounts Ahead of White House Crypto Meeting
- XRP News: Ripple Expands Custody Services to Ethereum and Solana Staking
- Bernstein Downplays Bitcoin Bear Market Jitters, Predicts Rally To $150k This Year
- Cardano Price Prediction as Bitcoin Stuggles Around $70k
- Bitcoin Price at Risk of Falling to $60k as Goldman Sachs Issues Major Warning on US Stocks
- Pi Network Price Outlook Ahead of This Week’s 82M Token Unlock: What’s Next for Pi?
- Bitcoin and XRP Price Prediction as China Calls on Banks to Sell US Treasuries
- Ethereum Price Prediction Ahead of Feb 10 White House Stablecoin Meeting
- Cardano Price Prediction as Midnight Token Soars 15%


