What’ Next For Ethereum Price? A Correction Or Another Breakout Past $2000?


Ethereum price is trading at $1894 with a slight gain of 0.8% in the last 24hrs at the time of reporting. The crypto market has shown impressive recovery since last week as market sentiment reflects positive sentiment towards the possible spot Bitcoin ETF in the US. The major altcoins are following the pioneer cryptocurrencies to a new wave of the recovery cycle.
Thus, the second largest crypto Ethereum registered price growth of 18.1% after bouncing off from a monthly low of $1627. Is the ETH price ready to prolong this rally, or can we witness a correction in the near future?
Also Read: Bitcoin, Ethereum Retraces After The BOE’s 50 Bps Rate Hike, US Fed Powell Testimony
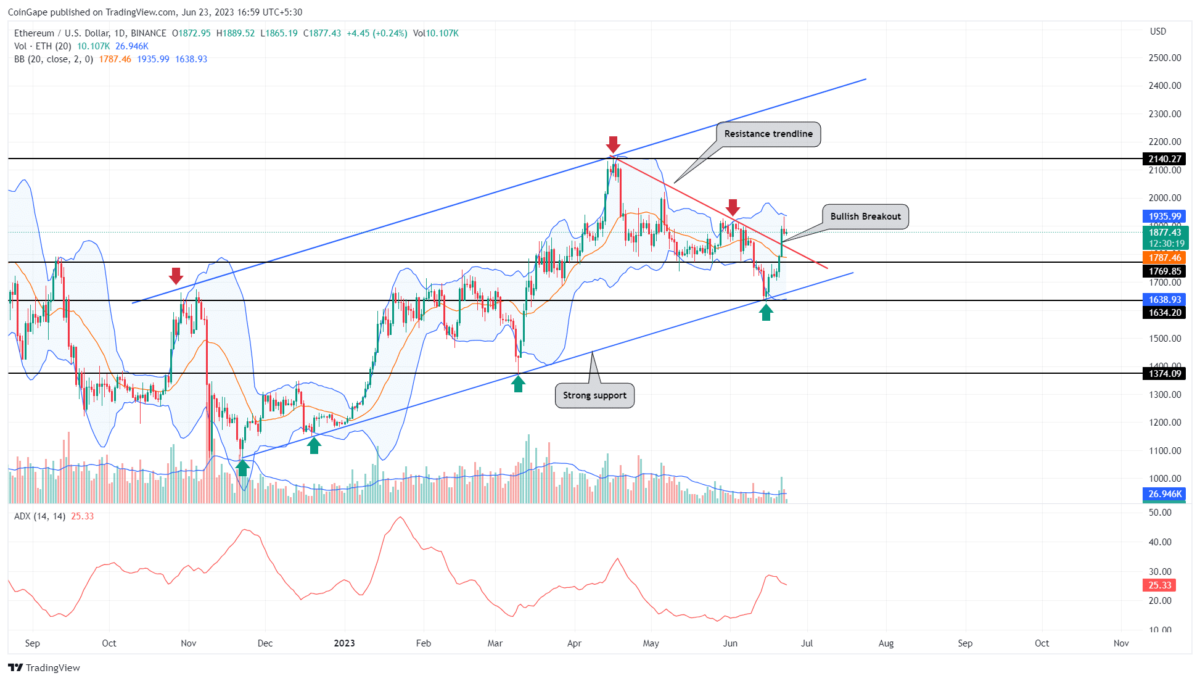
Ethereum Price Daily Chart
- The Higher price rejection candles at $1926 reflect a strong supply pressure at this level.
- The Ethereum price at $1879 could see a 3% pullback to retest the downsloping trendline.
- The intraday trading volume in Ether is $6.59 Billion, indicating a 43.5% gain.
 Source- Tradingview
The daily time frame chart showed a downsloping resistance trendline(red) carrying the last correction phase in the Ethereum price. However, with the recent recovery, the buyers gave a massive breakout from this dynamic resistance of June 21st.
This breakout back by a huge surge in volume reflected the buyers’ conviction to rise higher. In the early hours of June 22nd, the coin price showed a suitable follow-up to the bullish breakout, but couldn’t surpass the $1926 resistance.
The long-rejection candle printed at $1926 resistance reflects the overhead supply pressure which could revert the price lower. The potential reversal could allow traders to retest breached resistance and potential support to take the next leap.
Will the $ETH Price Rise Back to $2000?
The anticipated pullback to breached trendline can allow buyers a breather before resuming the current recovery cycle. If the Ethereum price shows sustainability above the flipped support, the buyers could drive the coin’s market value to 13.8% higher to reach 2023 high of $2138.
- Average Directional Index: The upswing in the daily ADX slope during the recent growth accentuates the buyers’ strength for a strong recovery.
- Bollinger Band: The upper band of the Bollinger Band indicator moving sideways at the $1926 level strengthens the resistance power for a bearish reversal.

Why Trust CoinGape
CoinGape has covered the cryptocurrency industry since 2017, aiming to provide informative insights Read more…to our readers. Our journal analysts bring years of experience in market analysis and blockchain technology to ensure factual accuracy and balanced reporting. By following our Editorial Policy, our writers verify every source, fact-check each story, rely on reputable sources, and attribute quotes and media correctly. We also follow a rigorous Review Methodology when evaluating exchanges and tools. From emerging blockchain projects and coin launches to industry events and technical developments, we cover all facets of the digital asset space with unwavering commitment to timely, relevant information.

Related Articles


- Expert Predicts Bitcoin Dip to $49K as ‘Trump Insider’ Whale Dumps 5,000 BTC
- Bitcoin Price Rebounds $70K, Here are the Top Reasons Why?
- Crypto Market Weekly Recap: Crypto Bill White House Meeting, Binance Buys $1B BTC, and More (9- Feb 13)
- TRUMP Coin Pumps 5% as Canary Capital Amends ETF Filing With New Details
- Crypto Prices Surge Today: BTC, ETH, XRP, SOL Soar Despite US Government Shutdown
- Crypto Price Prediction For the Week Ahead: Dogecoin, Solana and Cardano
- Bitcoin Price Prediction: How Could Brazil’s Strategic Bitcoin Reserve Proposal Impact BTC?
- 3 Top Reasons Pi Network Price Surging Today (14 Feb)
- XRP Price Prediction Ahead of Potential U.S. Government Shutdown Today
- Bitcoin Price Outlook As Gold And Silver Lose $3.6 Trillion in Market Value
- XRP and Ethereum Price Prediction as Trump Seeks to Lower Key Tariffs


