Here’s The Dogecoin Price Analysis Guide For The Coming Week


Under the influence of double bottom pattern formation and the recent recovery in the crypto market, the Dogecoin price rebounded from the $0.071-$0.068 support zone. This bullish reversal drove the prices 25% higher to reach the current price of $0.085. However, this bullish pattern could trigger significant growth in DOGE price and surpass $0.1. Should you enter now?
Key Points:
- A potential breakout from $0.09 resistance could set the Dogecoin price for a 22% rise.
- A daily candle closing below $0.08 will offset the bullish thesis.
- The 0.071-$0.068 trading volume in the Dogecoin coin is $452 Billion, indicating a 39% loss.
 Source-Tradingview
The formation of a double bottom pattern showcases multiple reversals from the $0.071-$0.068 mark, validating this level as a high accumulation zone. The memecoin recently rebounded from this mentioned support and is currently challenging a local resistance of $0.9.
However, The daily chart has shown several higher price rejection candles at $0.9 resistance since last week, indicating the seller continues to defend this level. If this supply pressure persists, the DOGE price could witness a consolidation between the aforementioned resistance and $0.08 support.
Anyhow, a minor consolidation could benefit Dogecoin as it will neutralize excessive buying from the prior recovery and check sustainability above the recently reclaimed support.
Also Read: Top Crypto Marketing Firms / Agencies 2023; Here’s Best Picks
Thus, a bullish breakout from the $0.9 barrier will signal the resumption of price recovery. This breakout may push the DOGE price 22% higher to challenge the $0.11 neckline resistance of the double bottom pattern.
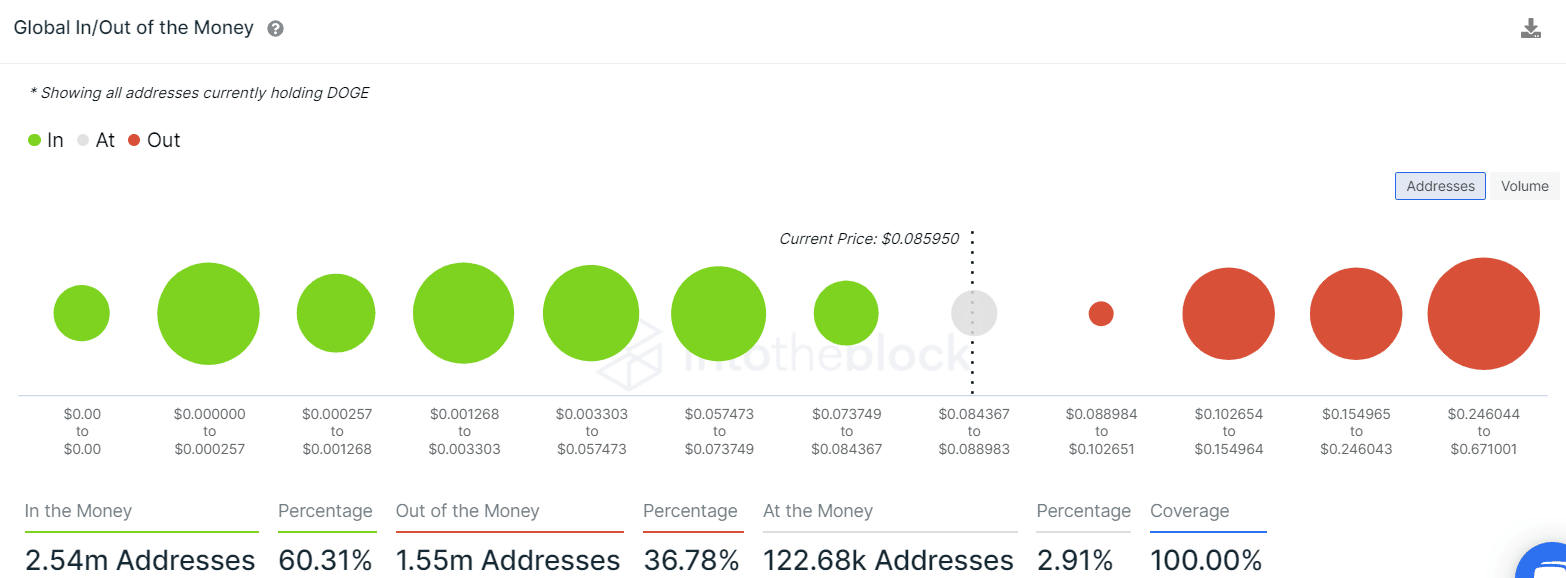
Global In/Out of the Money metric
 Source- intotheblock
Concerning the current price of Dogecoin, the Global In/Out of the Money (GIOM) on-chain metric indicates that 60.31% of DOGE addresses are in the money or realizing profits, whereas 36.78% are out of the money addresses witnessing losses.
Therefore, the major portion of the holding addresses is in profits, decreasing the possibility for them selling and inclined more towards holding for higher gains.
Technical indicator
RSI– a bearish divergence in the daily RSI slope reflects a drop in aggressive buying in the market. This divergence increases the possibility of minor consolidation before the next recovery cycle starts.
EMAs: the crucial EMAs (20, 50, 100, and 200) moving sideways indicate a sense of neutral sentiment in the market.
Dogecoin Price Intraday Levels
- Spot rate: $0.086
- Trend: Bullish
- Volatility: Medium
- Resistance levels- $0.09 and $0.11
- Support levels- $0.08 and $0.071

Why Trust CoinGape
CoinGape has covered the cryptocurrency industry since 2017, aiming to provide informative insights Read more…to our readers. Our journal analysts bring years of experience in market analysis and blockchain technology to ensure factual accuracy and balanced reporting. By following our Editorial Policy, our writers verify every source, fact-check each story, rely on reputable sources, and attribute quotes and media correctly. We also follow a rigorous Review Methodology when evaluating exchanges and tools. From emerging blockchain projects and coin launches to industry events and technical developments, we cover all facets of the digital asset space with unwavering commitment to timely, relevant information.
Related Articles


- Crypto Traders Reduce Fed Rate Cut Expectations Even as Expert Calls Fed Chair Nominee Kevin Warsh ‘Dovish’
- Crypto, Banks Clash Over Fed’s Proposed ‘Skinny’ Accounts Ahead of White House Crypto Meeting
- XRP News: Ripple Expands Custody Services to Ethereum and Solana Staking
- Bernstein Downplays Bitcoin Bear Market Jitters, Predicts Rally To $150k This Year
- Breaking: Tom Lee’s BitMine Adds 40,613 ETH, Now Owns 3.58% Of Ethereum Supply
- Cardano Price Prediction as Bitcoin Stuggles Around $70k
- Bitcoin Price at Risk of Falling to $60k as Goldman Sachs Issues Major Warning on US Stocks
- Pi Network Price Outlook Ahead of This Week’s 82M Token Unlock: What’s Next for Pi?
- Bitcoin and XRP Price Prediction as China Calls on Banks to Sell US Treasuries
- Ethereum Price Prediction Ahead of Feb 10 White House Stablecoin Meeting
- Cardano Price Prediction as Midnight Token Soars 15%


