Here’s Why ApeCoin Price May Drop Below The $4.26 Support
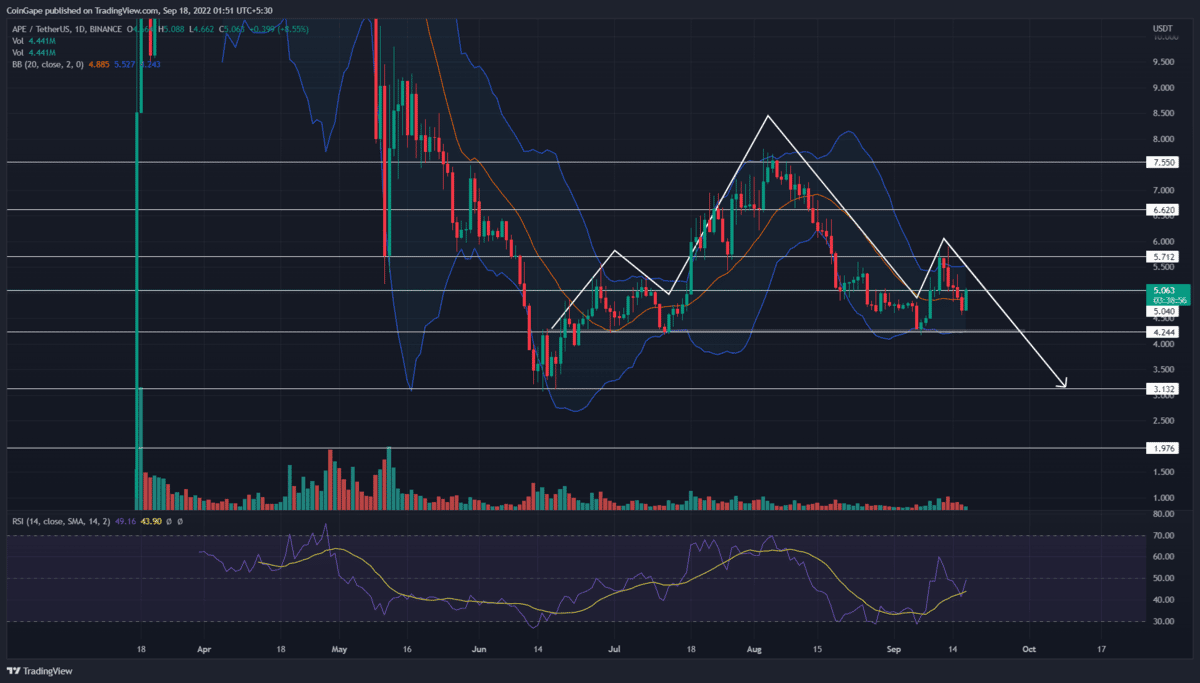
The V-Top reversal from the $5.7 resistance plummeted the Apecoin price below the $5 support. The altcoin is currently in a retest phase, and the post-retest fall may pull the prices to $4.42 support. Moreover, this level also acts as neckline support for head and shoulder pattern.
Key points Apecoin price analysis:
- The post-retest fall may plunge the price by 15%
- The 20-day EMA offers dynamic resistance to Apecoin priceApecoin price
- The intraday trading volume in Apecoin is $157.6 Million, indicating a 20.8% gain
Source-Tradingview
The Apecoin daily technical chart shows the formation of a head and shoulder pattern. This bullish pattern is often found in market tops as the prices display a trend reversal, switching from higher high formation to lower low formation.
Amid the recent sell-off in the crypto market, the altcoin turned down from the $5.7 resistance and bolstered the right shoulder portion of the pattern. The four-consecutive red candles registered a 19% loss and plug prices to $4.57 marked low.
Also read: Just-In: ApeCoin (APE) Community Gets Its Separate BAYC NFT Marketplace
Furthermore, the falling prices break a 20-day EMA and the local support of $5, indicating the sellers aim for another leg down. However, today, the coin is 7% and retests the breached resistance of $5.7.
However, the bullish candle aligned with lesser volume indicates weakness in bearish momentum. Thus, if the selling pressure persists, the Apecoin price may revert from the $5.5 resistance and breach the neckline support of $4.24.
A bearish breakdown from this pattern would accelerate the bullish momentum and challenge the June bottom support of 4.2%. The Apecoin price could reach the $2 mark per technical set-up.
On a contrary note, a daily candle above $5.7 will undermine the bearish pattern.
Technical Indicator
Bollinger band: the coin price breach the pattern’s midline from below, suggesting the buyers are looking for trend control. This mean line may also act as a dynamic resistance.
RSI indicator: the daily-RSI slope nosedived below the neutral line indicates the bearish sentiment building up among market participants.
- Resistance levels: $5.4 and $6
- Support levels: $4.2 and $3.2
Recent Posts
- Price Analysis
Will Solana Price Hit $150 as Mangocueticals Partners With Cube Group on $100M SOL Treasury?
Solana price remains a focal point as it responds to both institutional alignment and shifting…
- Price Analysis
SUI Price Forecast After Bitwise Filed for SUI ETF With U.S. SEC – Is $3 Next?
SUI price remains positioned at a critical intersection of regulatory positioning and technical structure. Recent…
- Price Analysis
Bitcoin Price Alarming Pattern Points to a Dip to $80k as $2.7b Options Expires Today
Bitcoin price rebounded by 3% today, Dec. 19, reaching a high of $87,960. This rise…
- Price Analysis
Dogecoin Price Prediction Points to $0.20 Rebound as Coinbase Launches Regulated DOGE Futures
Dogecoin price has gone back to the spotlight as it responds to the growing derivatives…
- Price Analysis
Pi Coin Price Prediction as Expert Warns Bitcoin May Hit $70k After BoJ Rate Hike
Pi Coin price rose by 1.05% today, Dec. 18, mirroring the performance of Bitcoin and…
- Price Analysis
Cardano Price Outlook: Will the NIGHT Token Demand Surge Trigger a Rebound?
Cardano price has entered a decisive phase as NIGHT token liquidity rotation intersects with structural…