Here’s Why Pepe Coin Price is at Risk of Losing $0.0000006 Support


The heightened selling pressure in the altcoin market has had a pronounced effect on Pepe coin, driving its price down significantly in a V-Top reversal pattern. The coin tumbled from a resistance level of $0.00000083 to its current trading price of $0.0000006, recording a steep loss of 21.8% in just a fortnight. If the bearish momentum sustains, the last swing low support at $0.0000006 will be tested, putting the memecoin at risk of an extended downtrend.
Also Read: Wall Street Estimates On US CPI, Bitcoin To Recover On Cooling Inflation
Can Pepe Price Sustain Above $0.0000006?
- The overhead supply pressure at the resistance trendline will set the PEPE price for a prolonged downfall.
- A breakout above the channel pattern is needed to start sustained recovery.
- The 24-hour trading volume in the Pepe coin is $39 Million, indicating a 15% gain.
 Source- Tradingview
The Pepe coin price has been consistently meeting resistance from the upper trend line of its channel pattern, indicative of an established downward trend. Currently, the market sentiment seems to be “sell on the bullish bounce,” making upward movements difficult for the coin.
However, today’s intraday gain of 8.4% indicates that buyers may attempt to challenge this overhead trend line once more. Should overhead supply pressure persist, this memecoin could break below its last swing low support of $0.0000006, intensifying the selling pressures.
A breakdown below this level would likely accelerate the coin’s decline to psychological support at $0.0000005, followed potentially by $0.0000004.
This bearish scenario could continue as long as the channel pattern holds.
PEPE vs DOGE vs SHIB Performance
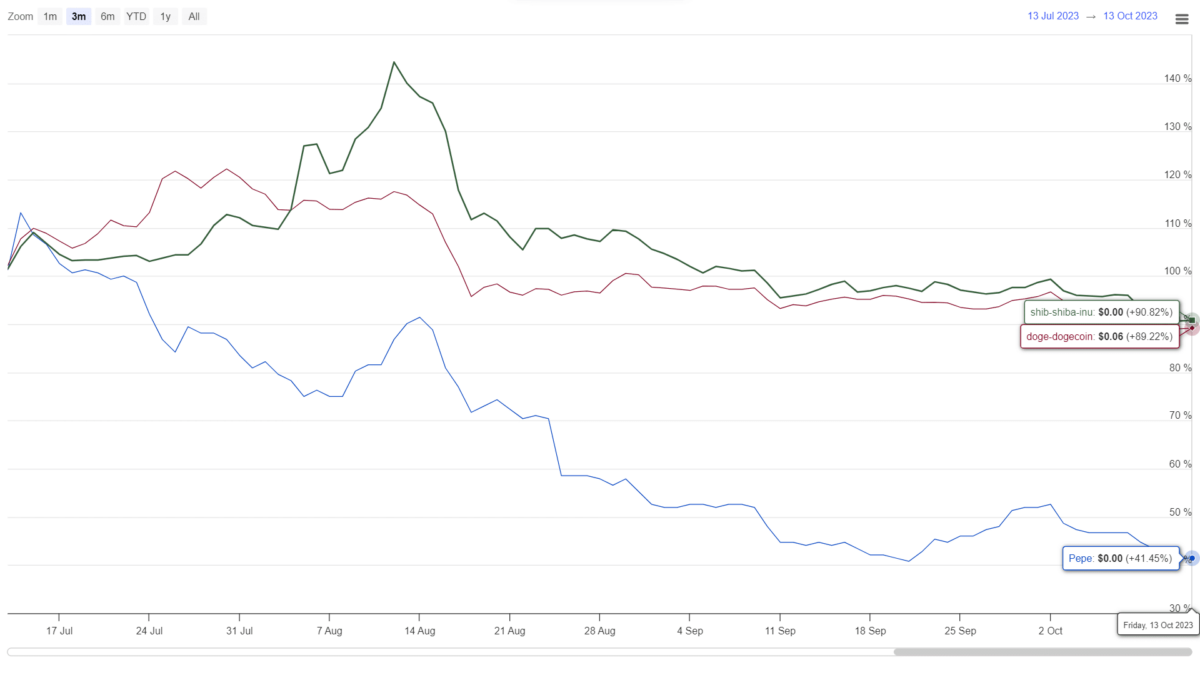 Source: Coingape| Pepe Coin Vs Dogecoin Vs Shiba Inu Price
In a broader context, the Pepe coin performance over the last three months has been markedly bearish compared to Dog-themed memecoins like Shiba Inu and Dogecoin, which have remained relatively stable in the face of market uncertainty. In addition, the PEPE price is at risk prolonged downtrend as the sellers are likely to break below the last swing low.
- Exponential Moving Average: the 20-day EMA slope acts as a dynamic resistance against buyers.
- Vortex Indicator: A wide spread between a bearish alignment of VI+(blue) and VI-(orange) slope in reflected market sentiment is negative.

Why Trust CoinGape
CoinGape has covered the cryptocurrency industry since 2017, aiming to provide informative insights Read more…to our readers. Our journal analysts bring years of experience in market analysis and blockchain technology to ensure factual accuracy and balanced reporting. By following our Editorial Policy, our writers verify every source, fact-check each story, rely on reputable sources, and attribute quotes and media correctly. We also follow a rigorous Review Methodology when evaluating exchanges and tools. From emerging blockchain projects and coin launches to industry events and technical developments, we cover all facets of the digital asset space with unwavering commitment to timely, relevant information.

Related Articles


- Expert Predicts Bitcoin Dip to $49K as ‘Trump Insider’ Whale Dumps 5,000 BTC
- Bitcoin Price Rebounds $70K, Here are the Top Reasons Why?
- Crypto Market Weekly Recap: Crypto Bill White House Meeting, Binance Buys $1B BTC, and More (9- Feb 13)
- TRUMP Coin Pumps 5% as Canary Capital Amends ETF Filing With New Details
- Crypto Prices Surge Today: BTC, ETH, XRP, SOL Soar Despite US Government Shutdown
- 3 Top Reasons Pi Network Price Surging Today (14 Feb)
- XRP Price Prediction Ahead of Potential U.S. Government Shutdown Today
- Bitcoin Price Outlook As Gold And Silver Lose $3.6 Trillion in Market Value
- XRP and Ethereum Price Prediction as Trump Seeks to Lower Key Tariffs
- Solana Price Prediction as $2.6 Trillion Citi Expands Tokenized Products to SOL
- Bitcoin Price Could Fall to $50,000, Standard Chartered Says — Is a Crash Coming?


