Litecoin Price Strikes Multi-Month Resistance, Is It Safe To Enter?


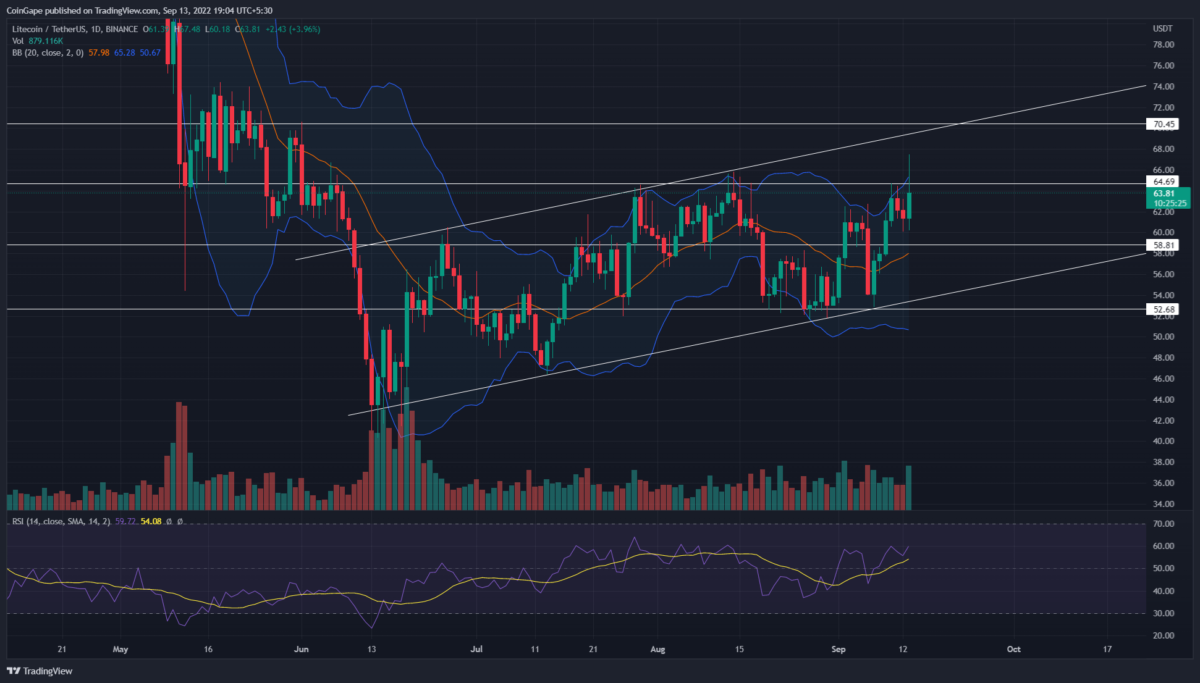
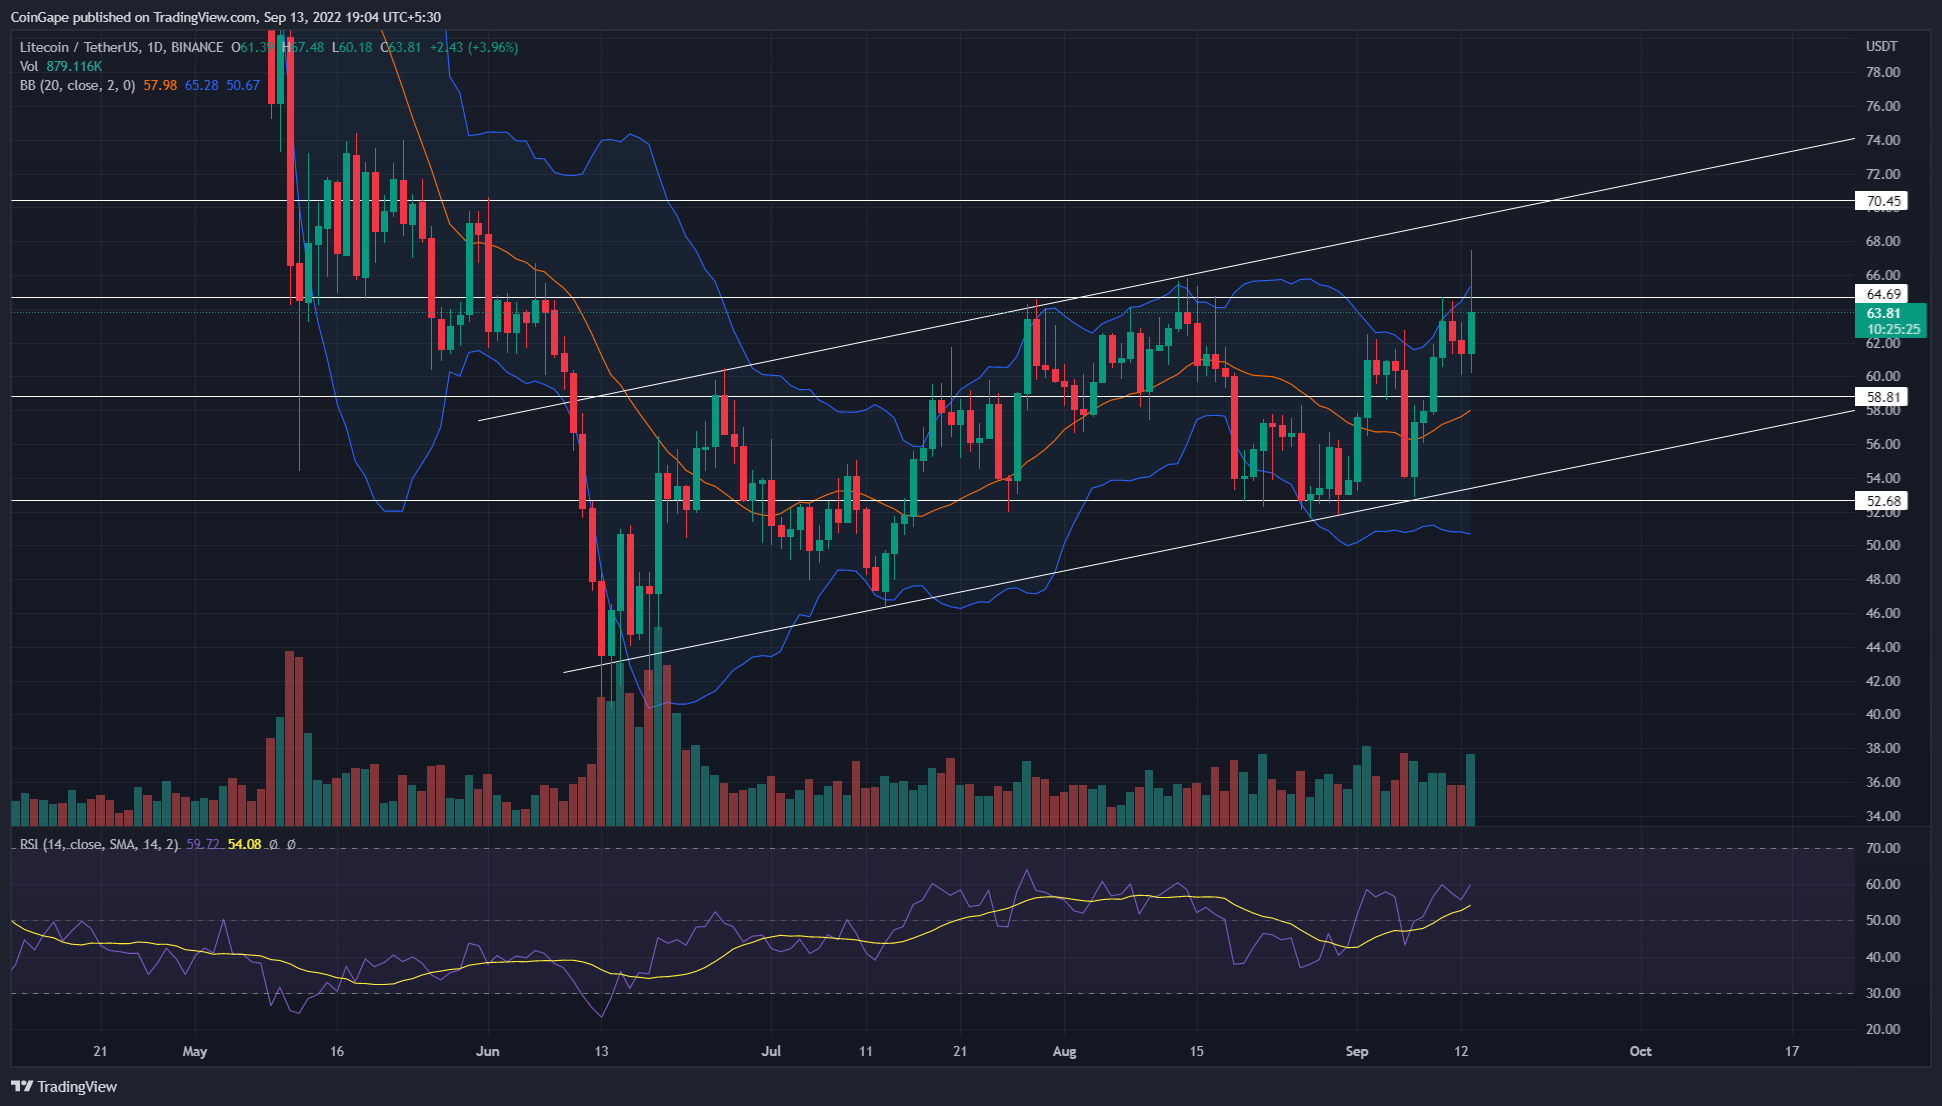
A rising parallel channel pattern governs the ongoing recovery in LTC/USDT pair. The recent bull cycle within this pattern was initiated when the coin price rebounded from the shared support of $52.7 and ascending trendline. However, the Litecoin price is struggling to surpass the $64.7 resistance . Click here to know how this chart pattern may influence litecoin’s future price.
Key points:
- The rising Litecoin price has halted at monthly resistance of $64.7 as the market condition witnesses a sudden selling pressure.
- The bullish recovery regains the 100-day EMA slope.
- The intraday trading volume in the Litecoin coin is $828.5 Million, indicating a 47.5% gain.
 Source- Tradingview
A bullish recovery from $52.7 support drove the prices 24.5% higher to hit a record high of $67.5. Thus, the technical chart shows the Litecoin price has breached the multiple-month resistance of $64.7. This resistance level reverted the price several times over the past three months.
Thus, a bullish breakout from this barrier with a suitable rise in volume activity will offer a long opportunity for interest traders. Anyhow, traders must wait for a daily candle closing above this resistance which may surge the Litecoin prices to the $70.5 mark.
However, by the press time, it seems the crypto market is facing sudden selling pressure due to the unexpected number in the consumer price index(CPI). As a result, Bitcoin has dropped 4.3% and Ethereum 5.4%.
Similarly, the Litecoin price has reverted below the mentioned resistance and lost most of its intraday gains. Thus, a long-wick rejection at the aforementioned important resistance($64.7) is unfavorable for buyers as it may further encourage a bearish reversal.
A potential reversal could pull the prices 7% lower to hit the local support of $58.8. Anyhow, the rising channel pattern is a bearish contention pattern, indicating the Litecoin price is eventually poised for a significant correction.
Thus, this pattern’s bullish breakout upper trendline will release the Bitcoin price from a bearish threat.
Technical indicator
Bollinger band indicator: similar to $64.7 resistance, the coin price shows rejections signs at the upper band of this pattern. Such signals usually result in price reversal to the midline support.
RSI: the indicator value at 60% suggests the overall market sentiment of Litecoin is bullish.
- Resistance Levels: $64.7 and $70.5
- Support Levels: $58.8 and $52.6

Why Trust CoinGape
CoinGape has covered the cryptocurrency industry since 2017, aiming to provide informative insights Read more…to our readers. Our journal analysts bring years of experience in market analysis and blockchain technology to ensure factual accuracy and balanced reporting. By following our Editorial Policy, our writers verify every source, fact-check each story, rely on reputable sources, and attribute quotes and media correctly. We also follow a rigorous Review Methodology when evaluating exchanges and tools. From emerging blockchain projects and coin launches to industry events and technical developments, we cover all facets of the digital asset space with unwavering commitment to timely, relevant information.