LUNC Price to Hit $0.00007? Bear Trap Bolster Buyers for 12% Jump


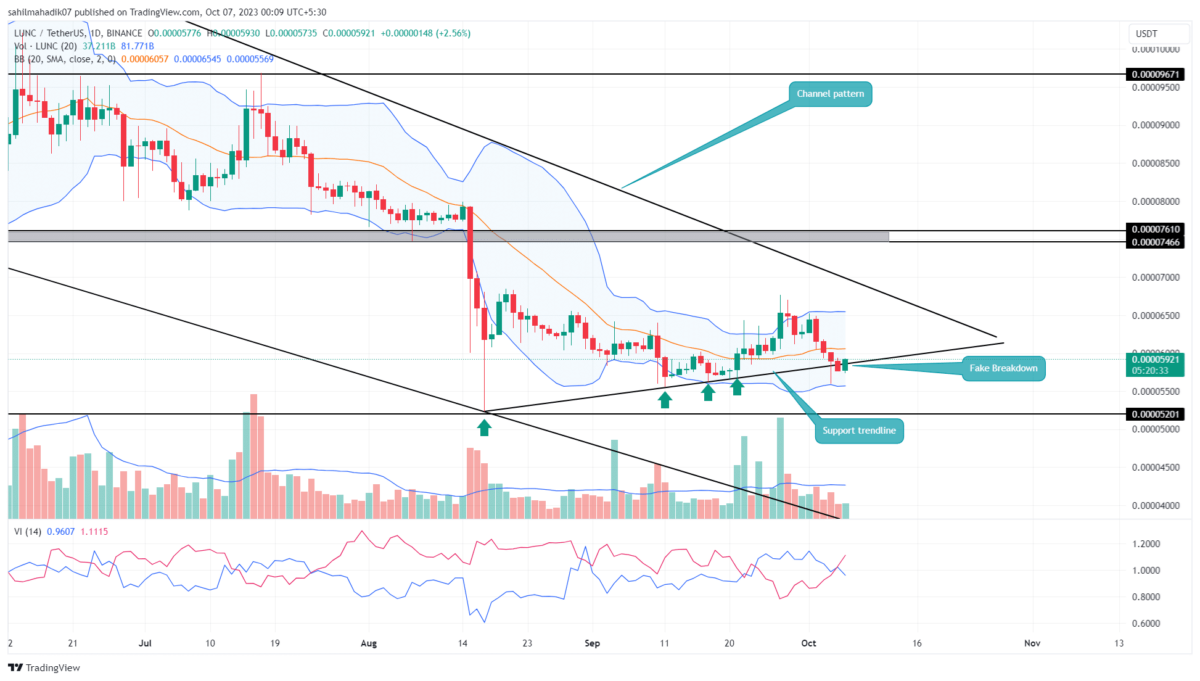
Over the last seven weeks of consolidation, an ascending support trendline has consistently bolstered the LUNC price, spurring a potential relief rally. Even amidst heightened market volatility, this supportive structure has shielded investors from a deeper price regression. Yet, the recent market downturn has emboldened sellers to challenge this formation, hinting at a possible impending decline.
Also Read: Terra Luna Classic Community Votes To Reset Validator Commission; LUNC To Rally?
Fake Breakdown May Start a New Recovery
- The coin sellers’ failure to sustain below $0.0000587 could trigger a bullish upswing
- A channel pattern leads the current correction trend in LUNC
- The intraday trading volume in the LUNC coin is $10.2 Million, indicating a 7.4% gain.
 Source- Tradingview
Since October’s onset, the Terra classic coin price has been on a downward spiral. In just the past week, the coin has depreciated by 9.47%, positioning itself at a current trading price of $0.000058. During this descent, the coin price gave a bearish breakdown from the new emerging support trendline on October 5th.
However, the low volume accompanying this downward movement, coupled with the lack of subsequent bearish action, suggests a potentially weakened bearish resolve. In today’s trading, the price has ascended by 1.84%, signaling a possible resurgence of buying interest.
Should the LUNC price reclaim its position above the trendline, with a daily candle closure confirming this, the previous bearish breach could be construed as a ‘bear trap’. This false breakdown could amplify buyer momentum, potentially propelling the coin to achieve a 12% increase, aiming for a resistance trendline, anchored closely to $0.000065.
Surpassing this pivotal 200day resistance trendline would provide a more bullish outlook, indicating a potential prolonged recovery
LUNC vs BTC Performance
 Source: Coingape| Terra Classic Vs Bitcoin Price
Analyzing the last six months’ price dynamics reveals that the Terra classic coin, lags notably behind the leading cryptocurrency, Bitcoin. The LUNC price chart delineates a bearish trajectory, punctuated by successive lower lows and lower highs. In contrast, the Bitcoin price movement has remained relatively stable. Given this disparity, investors eyeing this altcoin should exercise caution before making investment decisions.
- Bollinger Band: The flatti+sh lower band of the Bollinger Band indicator could offer additional support to buyers.
- Vortex Indicator: A bearish crossover between the VI±(blue) and VI(pink)- slope indicates the aggressive bearish momentum in the market

Why Trust CoinGape
CoinGape has covered the cryptocurrency industry since 2017, aiming to provide informative insights Read more…to our readers. Our journal analysts bring years of experience in market analysis and blockchain technology to ensure factual accuracy and balanced reporting. By following our Editorial Policy, our writers verify every source, fact-check each story, rely on reputable sources, and attribute quotes and media correctly. We also follow a rigorous Review Methodology when evaluating exchanges and tools. From emerging blockchain projects and coin launches to industry events and technical developments, we cover all facets of the digital asset space with unwavering commitment to timely, relevant information.