MATIC Price Analysis: Bear Trap Sets $MATIC Price for 12% Upswing


MATIC Price Analysis: On June 28th, the MATIC price breached an ascending support trendline which carried a relief rally for the past three weeks. The decisive breakdown in the daily chart was supposed to accelerate selling pressure and prolong the downward trend. However, the prices showed no follow-up to this breakdown indicating weakness in the sellers’ commitment and the buyer’s aggressiveness in lifting the prices higher. But how far may this recovery go?
Also Read: Polygon 2.0 Architecture Unveiled, MATIC Price Surges by 5.6%
MATIC Price Daily Chart
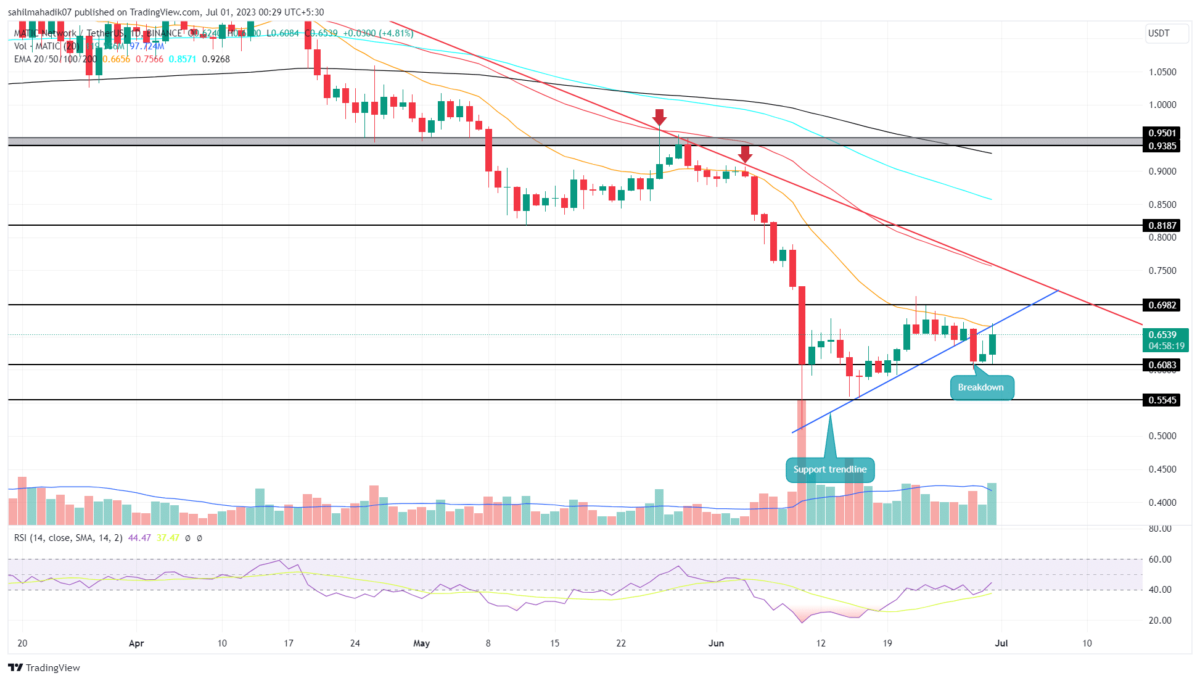
- A downsloping trendline(red) has carried a downtrend for the last four months.
- A fake breakdown from the support trendline(blue) may intensify the bullish momentum in the Polygon coin.
- The intraday trading volume in the MATIC is $443.5 Million, indicating a 59.5% gain.
 Source-Tradingview
Despite a breakdown of a significant support trendline, the MATIC price bounced back from the $0.6 support, with a formation bullish reversal candle pattern called the morning star. This candle development undermines the seller’s attempt to take the price lower and reflects the buyers’ strength to regain a higher price.
By the press time, the MATIC price trades at $0.65 with an intraday gain of 4.57%. With sustained, the buyers may reclaim the rising trendline which would mark the prior breakdown as a bear trap.
If the coin continues its upward rally, the short-sellers trapped with this breakdown would exit their position with buy orders and further accelerate the bullish momentum.
Thus, the resumed recovery may show 12% growth before it hits the next significant resistance of $0.7.
Will MATIC Price Surpass the $0.7 Mark?
If the bullish momentum rises, the polygon coin is likely to rise higher and reach the local resistance of $0.7. However, this horizontal resistance combined with a downsloping trendline creates a confluence barrier that triggers high supply pressure. If the coin chart started projecting rejection signs at this barrier the sellers may prolong the downward trend.
- Exponential Moving Average: The 20-and-50-day EMA slope offers dynamic resistance against rising prices.
- Relative strength index: despite the recent breakdown, the daily RSI slope also surged above the 40% mark accentuating the bullish sentiment is intact.

Why Trust CoinGape
CoinGape has covered the cryptocurrency industry since 2017, aiming to provide informative insights Read more…to our readers. Our journal analysts bring years of experience in market analysis and blockchain technology to ensure factual accuracy and balanced reporting. By following our Editorial Policy, our writers verify every source, fact-check each story, rely on reputable sources, and attribute quotes and media correctly. We also follow a rigorous Review Methodology when evaluating exchanges and tools. From emerging blockchain projects and coin launches to industry events and technical developments, we cover all facets of the digital asset space with unwavering commitment to timely, relevant information.

Related Articles


- Arizona Advances Bitcoin, XRP Reserve Bill Using Seized Crypto Assets
- Bitcoin ETF Update: BlackRock Signals BTC Sell-Off as Kevin O’Leary Warns of Decline In Institutional Demand
- Breaking: Tom Lee’s BitMine Buys 45,759 ETH as CryptoQuant Flags Potential Bottom For Ethereum
- Breaking: U.S. CFTC Moves To Defend Polymarket, Kalshi From Regulatory Crackdown By State Regulators
- Breaking: Michael Saylor’s Strategy Adds 2,486 BTC Amid Institutional Concerns Over Quantum Threat To Bitcoin
- Pi Network Price Beats Bitcoin, Ethereum, XRP as Upgrades and Potential CEX Listing Fuels Demand
- 5 Things Dogecoin Price Needs to Hit $0.20 in Feb 2026
- Bitcoin Price Prediction as Experts Warns of Quantum Risks
- Dogecoin, Shiba Inu, Pepe Coin Price Predictions As BTC Crashes Below $68k
- Ethereum Price Outlook as Harvard Shifts Focus from Bitcoin to ETH ETF
- HOOD and COIN Stock Price Forecast as Expert Predicts Bitcoin Price Crash to $10k


