MATIC Price Analysis: Can $0.5 Support Halt the Downward Spiral?


The MATIC price correction trend formed a new lower high at $0.891 and tumbled aggressively in the last five weeks. This downfall registered a 40% loss and evaporated the entire gain accumulated in the June-July rally. The falling prices may soon hit June 2022 at $0.509 to find suitable support. Can yearly support recuperate enough bullish momentum to kickstart a new recovery
Also Read: MATIC Price Heading to $0.5 Support; Buy this Dip?
MATIC Daily Chart: Key Points
- A bearish breakdown below $0.509 could extend the correction trend to $0.4 psychological support
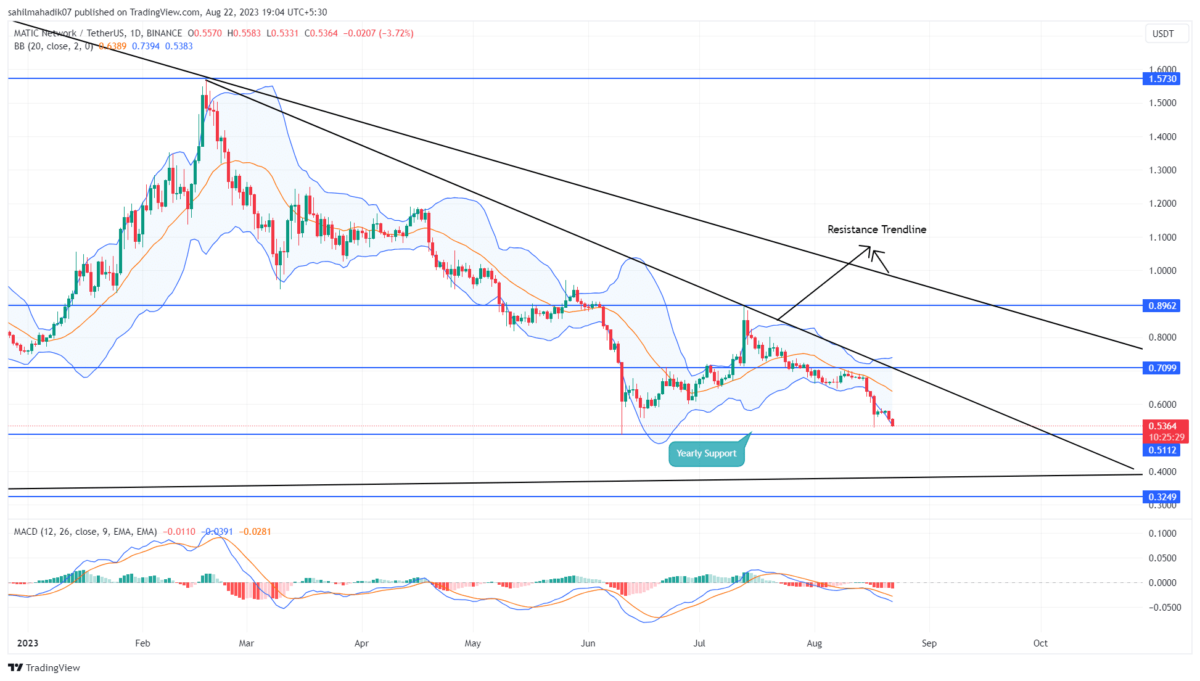
- An ascending trendline wavering near the $0.4 mark has remained intact for over two years and therefore could offer a high area of interest for a potential bullish reversal.
- The intraday trading volume of the MATIC coin is $292 Million, showing a 15% gain.
 Source- Tradingview
The polygon coin shows an evident V-top reversal from the $0.89. This downfall associated with rising volume indicates the sellers are aggressive and will lead to a prolonged correction in the near future.
Despite a significant price drop on August 17th triggered by broader market sentiment, the MATIC price continued a downward march, accentuating the active selling momentum. By the press time, this thirteenth largest cryptocurrency trades at $0.538, with an intraday loss of 3.34%
If the selling sentiment persists, the polygon coin could give a breakdown below the $0.509 support, The post breakdown may tumble the prices by 25% and hit a long-coming support trendline.
[converter id=”matic-polygon” url=”https://coingape.com/price/converter/polygon-to-usd/?amount=1″]
Can Polygon Coin Recovery Back to $0.9?
While the MATIC price behavior reflects the continuation of a downward trend, the coin buyers can obtain a long opportunity after a breakout of the overhead trendline. This resistance trendline is currently carrying the correction, and therefore its breakout could assist buyers to rechallenge the $0.07 or $0.9 barrier
- Bollinger Band: The downtick in the lower band on the Bollinger band indicator reflects the selling momentum is still aggressive.
- Moving Average Convergence Divergence: A bearish alignment between the MACD(blue) and signal(orange) project a downtrend sentiment.

Why Trust CoinGape
CoinGape has covered the cryptocurrency industry since 2017, aiming to provide informative insights Read more…to our readers. Our journal analysts bring years of experience in market analysis and blockchain technology to ensure factual accuracy and balanced reporting. By following our Editorial Policy, our writers verify every source, fact-check each story, rely on reputable sources, and attribute quotes and media correctly. We also follow a rigorous Review Methodology when evaluating exchanges and tools. From emerging blockchain projects and coin launches to industry events and technical developments, we cover all facets of the digital asset space with unwavering commitment to timely, relevant information.

Related Articles


- Arizona Advances Bitcoin, XRP Reserve Bill Using Seized Crypto Assets
- Bitcoin ETF Update: BlackRock Signals BTC Sell-Off as Kevin O’Leary Warns of Decline In Institutional Demand
- Breaking: Tom Lee’s BitMine Buys 45,759 ETH as CryptoQuant Flags Potential Bottom For Ethereum
- Breaking: U.S. CFTC Moves To Defend Polymarket, Kalshi From Regulatory Crackdown By State Regulators
- Breaking: Michael Saylor’s Strategy Adds 2,486 BTC Amid Institutional Concerns Over Quantum Threat To Bitcoin
- Pi Network Price Beats Bitcoin, Ethereum, XRP as Upgrades and Potential CEX Listing Fuels Demand
- 5 Things Dogecoin Price Needs to Hit $0.20 in Feb 2026
- Bitcoin Price Prediction as Experts Warns of Quantum Risks
- Dogecoin, Shiba Inu, Pepe Coin Price Predictions As BTC Crashes Below $68k
- Ethereum Price Outlook as Harvard Shifts Focus from Bitcoin to ETH ETF
- HOOD and COIN Stock Price Forecast as Expert Predicts Bitcoin Price Crash to $10k


