Overhead Supply Hints BTC Price Correction Below $27000


Over the past week, the Bitcoin price action has primarily been horizontal, underscoring its difficulty in breaching the $28,500 resistance. Current geopolitical unrest in the Middle East, arising from the ongoing conflict between Israel and Hamas, has further added to the market’s uncertainty, positioning Bitcoin for a potential bearish pivot. A shift in this direction might not only interrupt the recent selling stagnation but could also precipitate a more profound correction.
Also Read: Binance CEO “CZ” Makes Bold Post-Halving Bitcoin Prediction
Is Bitcoin Heading to $25000?
- A bullish breakout from the upper trendline could kick-start a fresh recovery
- The golden crossover between the 50-and-100-day EMAs could intensify the bullish momentum.
- The intraday trading volume in Bitcoin is $11.5 Billion, indicating a 56% gain.
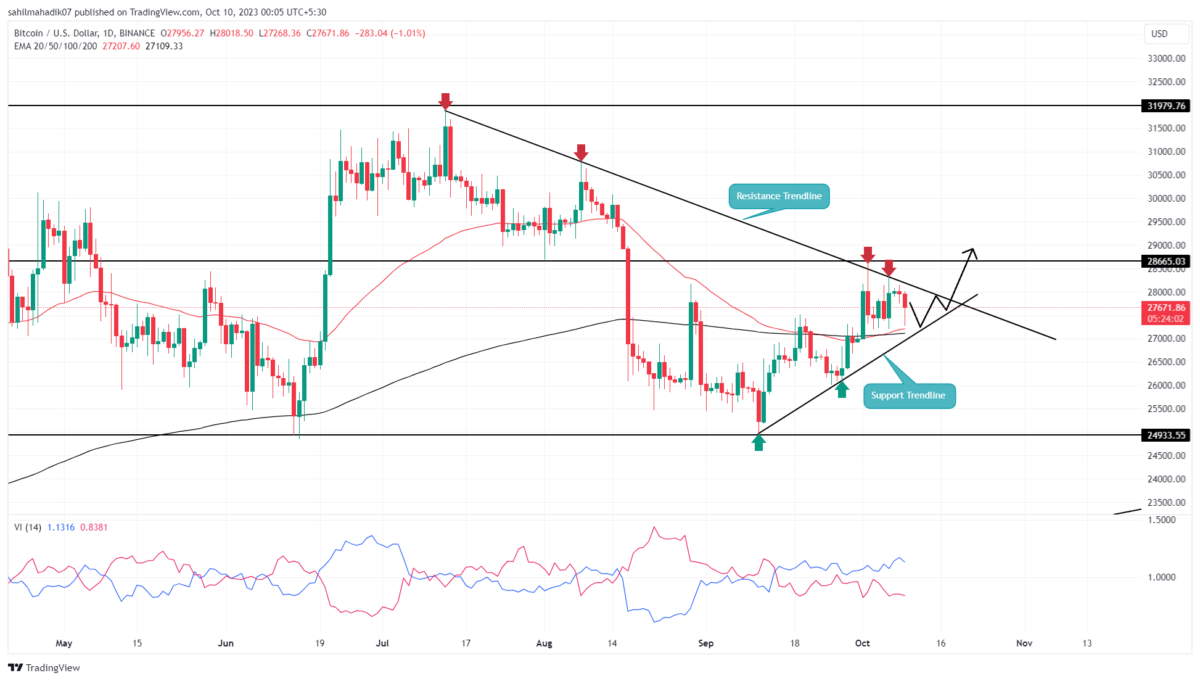
 Source-Tradingview
Underpinned by a persistent resistance trendline, the Bitcoin price trajectory has been on a downward course for nearly two months. During this descent, each approach to this trendline coincided with an uptick in selling pressure, subsequently driving the asset into pronounced pullbacks.
Currently, with the BTC price lingering below this resistance trendline and manifesting patterns of rejection candles, the charts are signaling a likely continuation of this bearish sentiment. At present, the coin is valued at $27,631, recording a 1.17% decline within the day.
Should the anticipated bearish swing decisively breach the 200-day EMA and an emergent support trendline, sellers could be emboldened, propelling the BTC price into a deeper correction.
Such a move could see this coin’s value recede by approximately 10%, potentially testing the psychological threshold of $25,000.
[converter id=”btc-bitcoin” url=”https://coingape.com/price/converter/btc-to-usd/”]
Will BTC Price Resume the Recovery Trend?
While the short-term projection for Bitcoin price remains bearish, the Dow Theory of Financial Markets reflects that no trend remains the same. Hence, investors bullish on Bitcoin might consider awaiting a definitive bullish breakout above the current resistance. Such a breakout would not only signify the culmination of the prevailing bearish phase but also herald the onset of a renewed bullish cycle. A subsequent rally post such a breakout could propel Bitcoin price toward the $30,000 mark.
- Exponential Moving Average: The 50-and-200-day EMA wavering around the $27000 mark increases the support strength of this level.
- Vortex Indicator: A bullish alignment between the VI+(blue) and VI-(orange) slope indicates a buyer holds enough momentum to rechallenge the overhead trendline.

Why Trust CoinGape
CoinGape has covered the cryptocurrency industry since 2017, aiming to provide informative insights Read more…to our readers. Our journal analysts bring years of experience in market analysis and blockchain technology to ensure factual accuracy and balanced reporting. By following our Editorial Policy, our writers verify every source, fact-check each story, rely on reputable sources, and attribute quotes and media correctly. We also follow a rigorous Review Methodology when evaluating exchanges and tools. From emerging blockchain projects and coin launches to industry events and technical developments, we cover all facets of the digital asset space with unwavering commitment to timely, relevant information.
Related Articles


- Coinbase Directors Faces Insider Trading Lawsuit Despite Internal Clearance of Charges
- Tennessee Advances Bitcoin Reserve Bill as Strategic BTC Adoption Grows in the U.S
- CLARITY Act Set to Progress as Coinbase and Banks Meet on Monday to Resolve Stablecoin Dispute
- CLARITY Act: Coinbase’s Brian Armstrong and JPMorgan’s Jamie Dimon Clash Over Crypto Bill
- Fed Rate Cut: Trump Signals Fed Chair Pick Kevin Warsh Will Lower Rates
- Ethereum Price Prediction As Vitalik Withdraws ETH Worth $44M- Is a Crash to $2k ahead?
- Bitcoin Price Prediction as Trump Names Kevin Warsh as new Fed Reserve Chair
- XRP Price Outlook Ahead of Possible Government Shutdown
- Ethereum and XRP Price Prediction as Odds of Trump Attack on Iran Rise
- Gold and S&P 500 Price Prediction as BTC $88K Sparks Global Risk-On Rally
- How High Can Hyperliquid Price Go in Feb 2026?


