Overhead Supply Puts Bitcoin Price Under Correction Threat; Back to $29000?
Within the last two weeks, the Bitcoin price showcased a remarkable recovery as it jumped from $25000 to the $31150 mark. The aforementioned level is also the April 2023 peak and therefore holds sufficient supply pressure to tackle bulls. The daily chart started projecting long-wick rejections indicating the sellers are actively defending this level. Are the bulls exhausted, or is this a pullback before the next leap?
Also Read: Bitcoin Bull Run: BlackRock BTC ETF Likely To Get Green Flag
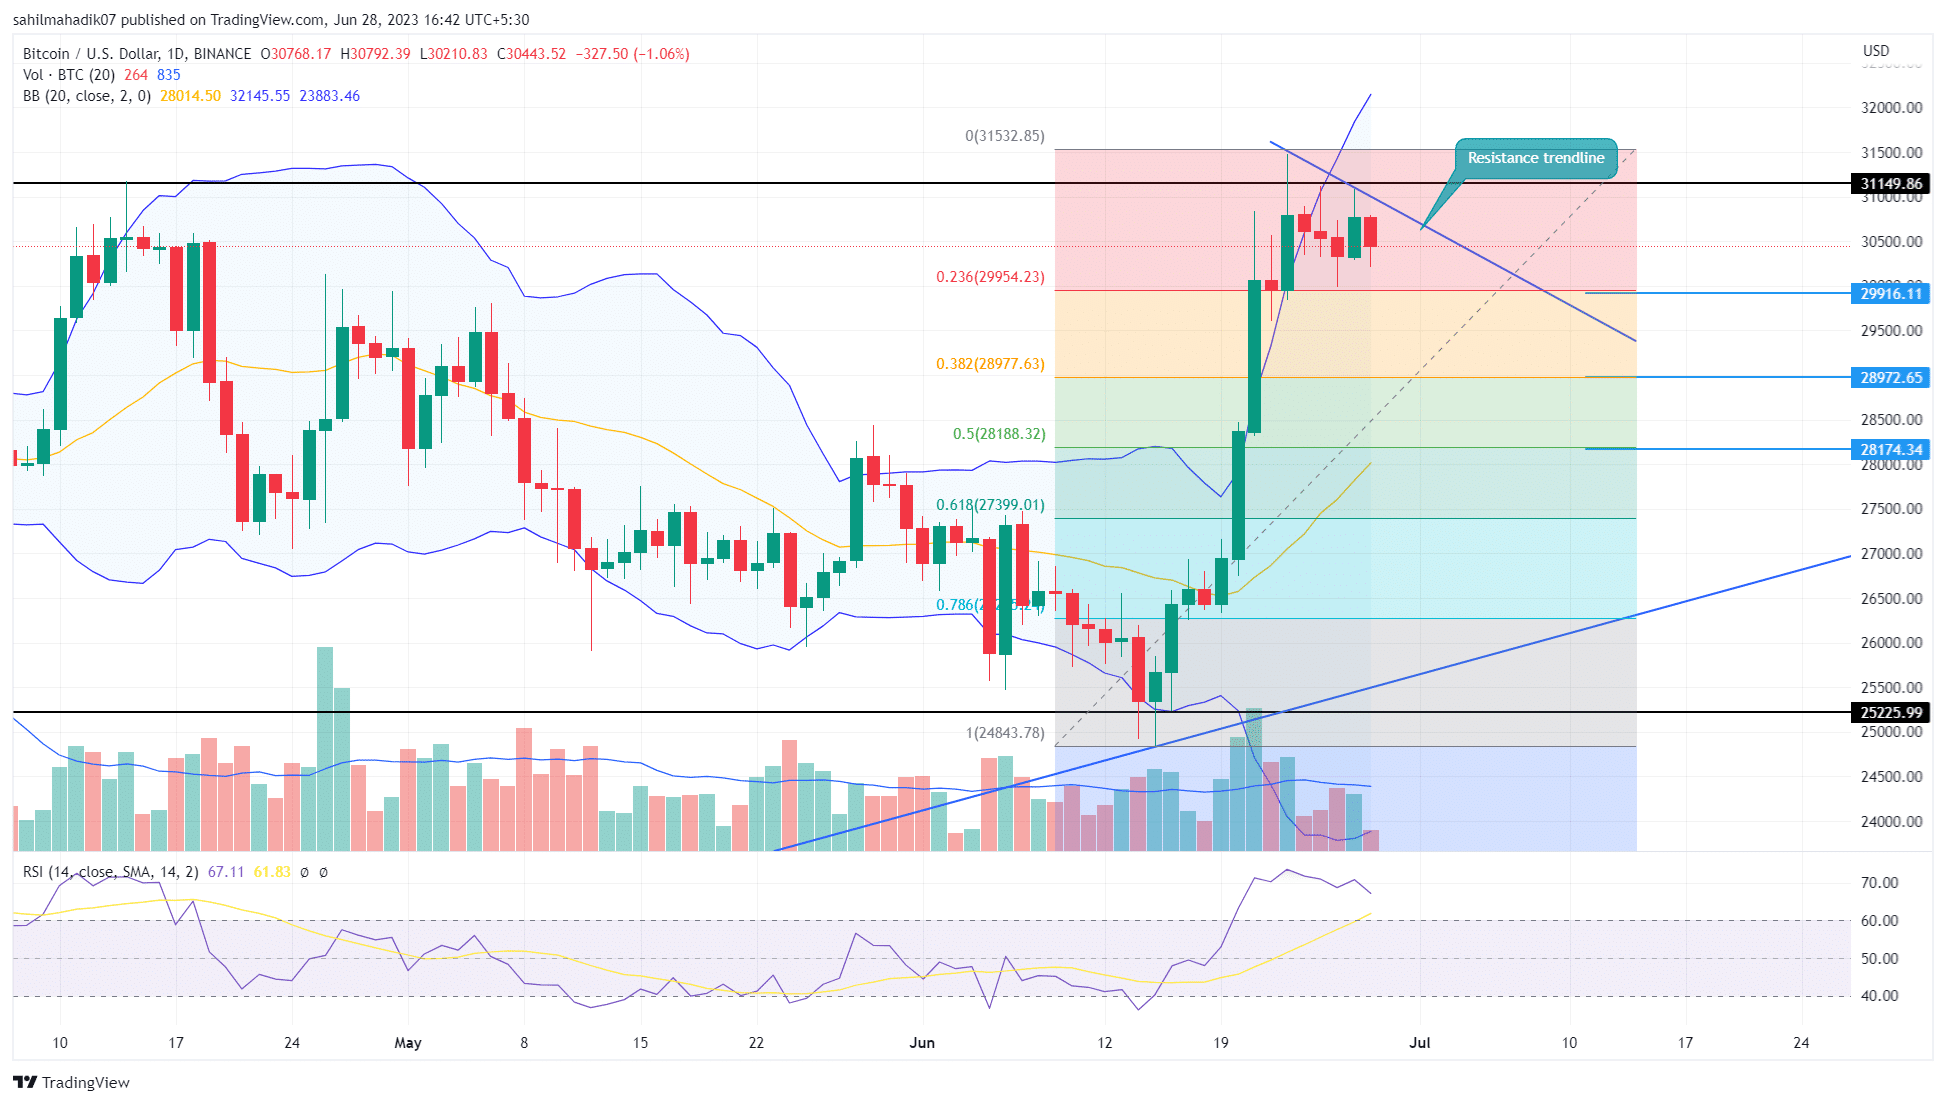
Bitcoin Price Daily Chart:
- A new downsloping trendline can carry the potential correction in Bitcoin price
- Amid the current downfall, the decreasing volume suggests the correction phase is temporary.
- The intraday trading volume in Bitcoin is $9.12 billion, indicating a 38% loss.
The overhead supply pressure has stalled Bitcoin price growth at $31150. Moreover, the higher-price rejection candles at this resistance indicate a higher possibility of a bearish reversal.
Anyways, this potential correction could be beneficial for BTC buyers to maintain the long run. This retracement could absorb the build-up selling pressure and replenish the exhausted bullish momentum.
As per the Fibonacci retracement tool, the $30000 aligned with 23.6% FIB, followed by $28980(38.2%) and $29000(50%) stands as an important support zone that will assist buyers to maintain a bullish outlook
Will Bitcoin Price Surpass $31500?
The daily time frame chart shows a new resistance trendline that can be used to follow the possible pullback in Bitcoin price. Until this dynamic resistance is intact, the coin price will maintain a downtrend and could plunge to the nearest support zone of $30000, and $28980. Therefore, a breakout above this trendline will be a key signal for uptrend continuation.
- Fibonacci retracement levels: Until the Bitcoin price holds above the 50% FIB level the overall trend remains bullish
- Exponential Moving Average: The 20-day EMA slope wavering near the $28980 level creates a strong support zone.
Recent Posts
- Price Analysis
Will Solana Price Hit $150 as Mangocueticals Partners With Cube Group on $100M SOL Treasury?
Solana price remains a focal point as it responds to both institutional alignment and shifting…
- Price Analysis
SUI Price Forecast After Bitwise Filed for SUI ETF With U.S. SEC – Is $3 Next?
SUI price remains positioned at a critical intersection of regulatory positioning and technical structure. Recent…
- Price Analysis
Bitcoin Price Alarming Pattern Points to a Dip to $80k as $2.7b Options Expires Today
Bitcoin price rebounded by 3% today, Dec. 19, reaching a high of $87,960. This rise…
- Price Analysis
Dogecoin Price Prediction Points to $0.20 Rebound as Coinbase Launches Regulated DOGE Futures
Dogecoin price has gone back to the spotlight as it responds to the growing derivatives…
- Price Analysis
Pi Coin Price Prediction as Expert Warns Bitcoin May Hit $70k After BoJ Rate Hike
Pi Coin price rose by 1.05% today, Dec. 18, mirroring the performance of Bitcoin and…
- Price Analysis
Cardano Price Outlook: Will the NIGHT Token Demand Surge Trigger a Rebound?
Cardano price has entered a decisive phase as NIGHT token liquidity rotation intersects with structural…