Overhead Supply Puts Bitcoin Price Under Correction Threat; Back to $29000?


Within the last two weeks, the Bitcoin price showcased a remarkable recovery as it jumped from $25000 to the $31150 mark. The aforementioned level is also the April 2023 peak and therefore holds sufficient supply pressure to tackle bulls. The daily chart started projecting long-wick rejections indicating the sellers are actively defending this level. Are the bulls exhausted, or is this a pullback before the next leap?
Also Read: Bitcoin Bull Run: BlackRock BTC ETF Likely To Get Green Flag
Bitcoin Price Daily Chart:
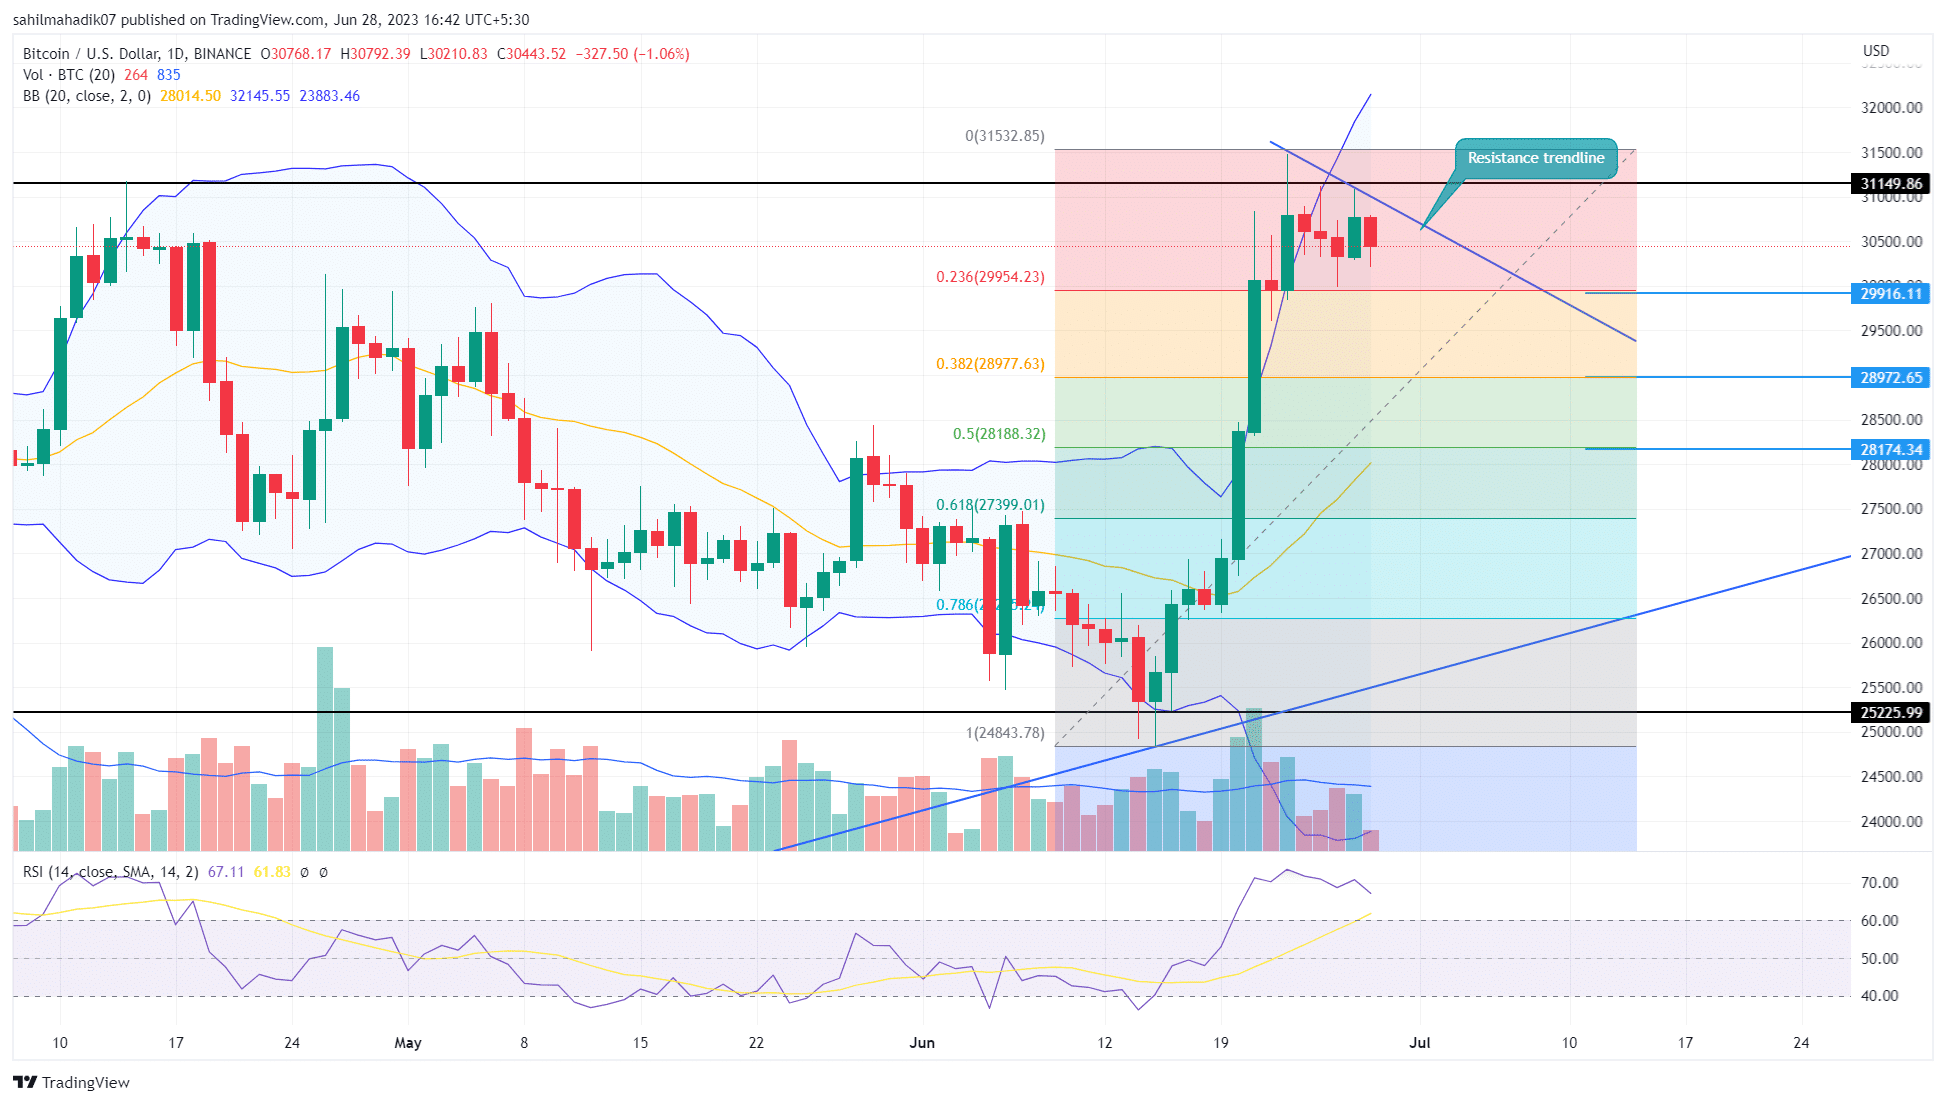
- A new downsloping trendline can carry the potential correction in Bitcoin price
- Amid the current downfall, the decreasing volume suggests the correction phase is temporary.
- The intraday trading volume in Bitcoin is $9.12 billion, indicating a 38% loss.
 (Source: Tradingview)
The overhead supply pressure has stalled Bitcoin price growth at $31150. Moreover, the higher-price rejection candles at this resistance indicate a higher possibility of a bearish reversal.
Anyways, this potential correction could be beneficial for BTC buyers to maintain the long run. This retracement could absorb the build-up selling pressure and replenish the exhausted bullish momentum.
As per the Fibonacci retracement tool, the $30000 aligned with 23.6% FIB, followed by $28980(38.2%) and $29000(50%) stands as an important support zone that will assist buyers to maintain a bullish outlook
Will Bitcoin Price Surpass $31500?
The daily time frame chart shows a new resistance trendline that can be used to follow the possible pullback in Bitcoin price. Until this dynamic resistance is intact, the coin price will maintain a downtrend and could plunge to the nearest support zone of $30000, and $28980. Therefore, a breakout above this trendline will be a key signal for uptrend continuation.
Why Trust CoinGape
CoinGape has covered the cryptocurrency industry since 2017, aiming to provide informative insights Read more…to our readers. Our journal analysts bring years of experience in market analysis and blockchain technology to ensure factual accuracy and balanced reporting. By following our Editorial Policy, our writers verify every source, fact-check each story, rely on reputable sources, and attribute quotes and media correctly. We also follow a rigorous Review Methodology when evaluating exchanges and tools. From emerging blockchain projects and coin launches to industry events and technical developments, we cover all facets of the digital asset space with unwavering commitment to timely, relevant information.


Will Bitcoin reach $250,000 by December 31, 2026?