Pepe Coin Price Prediction: Can EMA Golden Crossover Fuel a Rally to $0.000002?


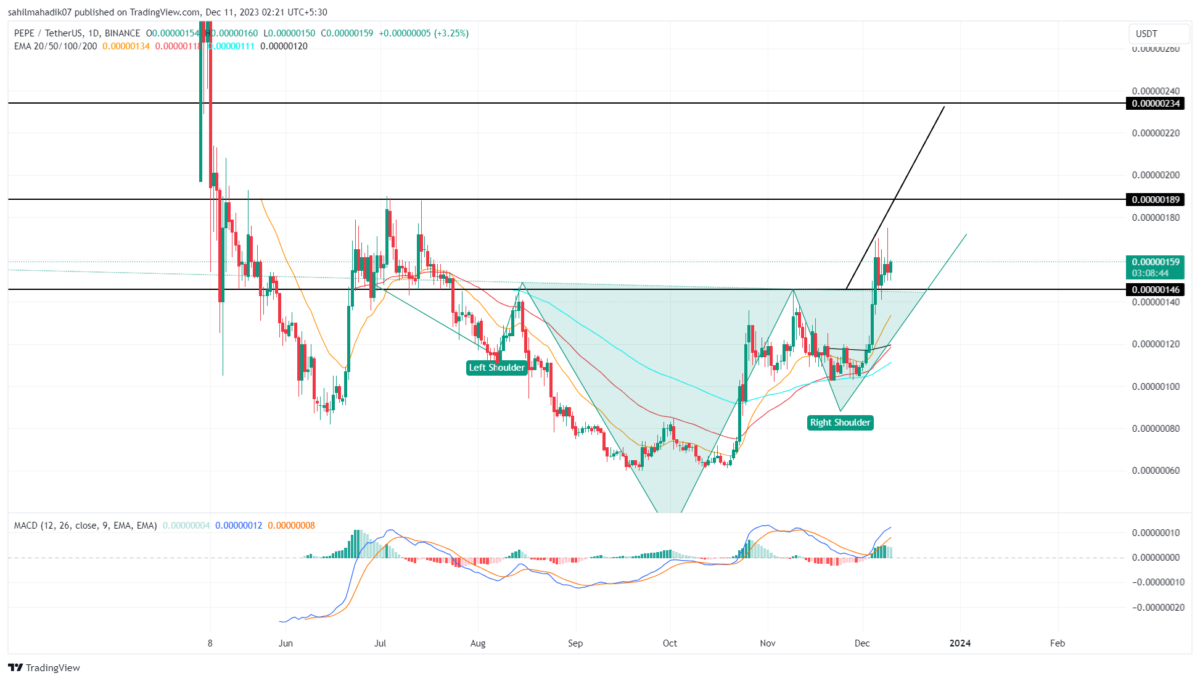
Pepe Coin Price Prediction: Over the past four months, the PEPE price traded sideways reflecting no initiation from buyers or sellers. However, a look at the technical chart revealed this consolidation as the formation of bullish reversal patterns called inverted head and shoulder patterns. A recent breakout from this pattern’s neckline has indicated the buyers are ready to take control.
Also Read: Bitcoin (BTC) “Past Performance is no Guarantee of Future Results” – VanEck
Bullish Pattern Sets $PEPE for Higher Recovery
- The rising PEPE price could face overhead support at $0.00000190 and $0.00000234
- The 50-day EMA slope continues to offer pullback support.
- The 24-hour trading volume in the Pepe coin is $149 Million, indicating a 39% loss.

On December 5th, the Pepe coin price recovery gave a decisive breakout from the neckline resistance of the inverted head and shoulder pattern. This breakout from this pattern has been an early sign of trend reversal and a long-position entry opportunity.
However, the post-breakout rally halts near the $0.0000017 mark, as the border market sentiment turns uncertain in response to Bitcoin price stalling in recovering momentum. Thus, Pepe is resonating in a narrow range between the aforementioned level and breached $0.0000146 support.
With the overall trend intact and the influence of a bullish breakout, the PEPE price is likely to resume the recovery trend. The post-breakout rally could surge the prices 48% higher to hit the $0.00000235 mark.
Is PEPE Price At a Risk of Major Correction?
While the overall outlook for Pepe coin price remains bullish, the current consolidation above $0.00000146 despite a breakout reflects weakness in buyers’ conviction. Usually, the breakout moves are rapid and fast-moving, and thus such a long consolidation would decrease the potential of recovery and a threat for downtrend contention. A breakdown below the $0.00000146 mark would invalidate the aforementioned bullish thesis.
- Exponential Moving Average: A potential golden crossover between the 50-and-200-day EMA could accelerate the buying momentum for higher growth.
- Moving Average Convergence Divergence: The MACD and a signal line above the zero line in a bullish crossover state reflect the bullish trend is z

Why Trust CoinGape
CoinGape has covered the cryptocurrency industry since 2017, aiming to provide informative insights Read more…to our readers. Our journal analysts bring years of experience in market analysis and blockchain technology to ensure factual accuracy and balanced reporting. By following our Editorial Policy, our writers verify every source, fact-check each story, rely on reputable sources, and attribute quotes and media correctly. We also follow a rigorous Review Methodology when evaluating exchanges and tools. From emerging blockchain projects and coin launches to industry events and technical developments, we cover all facets of the digital asset space with unwavering commitment to timely, relevant information.
Pepe
24 Hours volume
$1.11B
Market Cap
$2.09B
Max Supply
420.69T

Related Articles


- Expert Predicts Bitcoin Dip to $49K as ‘Trump Insider’ Whale Dumps 5,000 BTC
- Bitcoin Price Rebounds $70K, Here are the Top Reasons Why?
- Crypto Market Weekly Recap: Crypto Bill White House Meeting, Binance Buys $1B BTC, and More (9- Feb 13)
- TRUMP Coin Pumps 5% as Canary Capital Amends ETF Filing With New Details
- Crypto Prices Surge Today: BTC, ETH, XRP, SOL Soar Despite US Government Shutdown
- Crypto Price Prediction For the Week Ahead: Dogecoin, Solana and Cardano
- Bitcoin Price Prediction: How Could Brazil’s Strategic Bitcoin Reserve Proposal Impact BTC?
- 3 Top Reasons Pi Network Price Surging Today (14 Feb)
- XRP Price Prediction Ahead of Potential U.S. Government Shutdown Today
- Bitcoin Price Outlook As Gold And Silver Lose $3.6 Trillion in Market Value
- XRP and Ethereum Price Prediction as Trump Seeks to Lower Key Tariffs


