PEPE Price Analysis: Double Bottom Pattern Sets Pepe Coin for 28% Rally
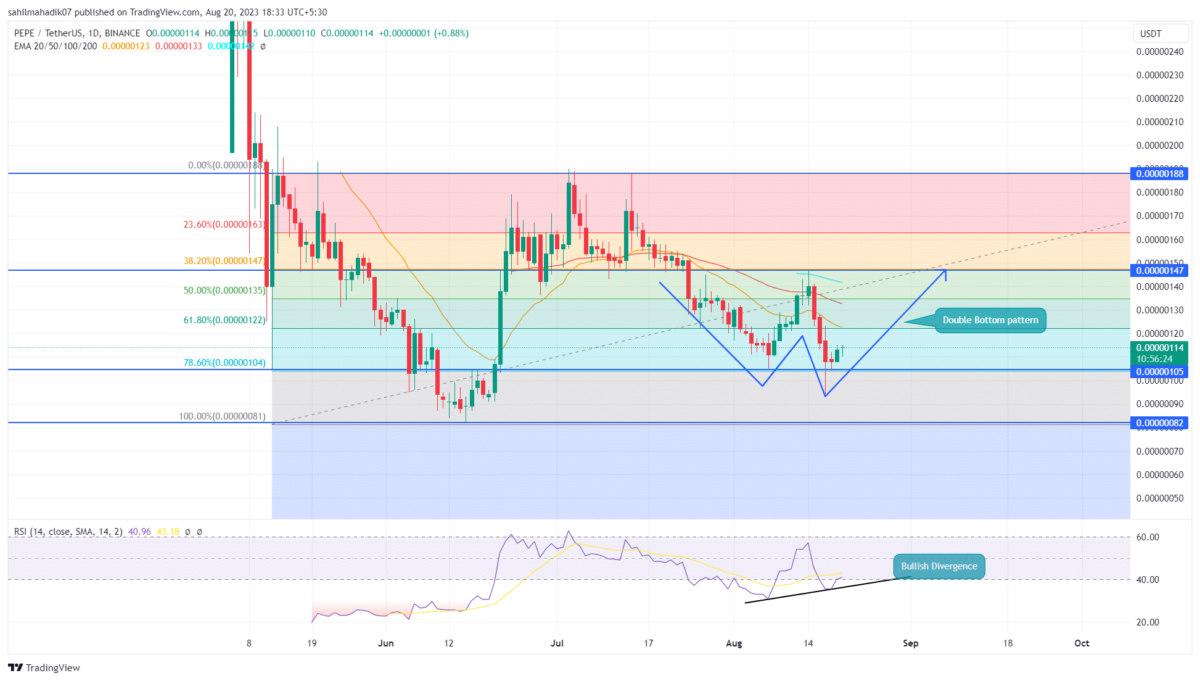
The Frog-themed memecoin PEPE started witnessing aggressive selling pressure from mid-August, leading to a sharp reversal from the $0.00000147 mark. This downfall bolstered by a broader market sell-off triggered a 29% drop and pushed the prices back to $0.00000105 local support. The PEPE price sustainability at this support accentuates the investors accumulating at a discounted price and the potential for a bullish rebound.
Also Read: Pepe Coin Leads Crypto Recovery; PEPE Price Jumps By 5%
Pepecoin Daily Chart: Key Points
- The PEPE price witnessed high demand pressure at the $0.00000105 mark
- A bulls divergence in the daily RSI shop reflects the underlying bullish momentum is rising
- The 24-hour trading volume in the Pepe coin is $67.9 Million, indicating a 14.5 % loss.
After the early week sell-off in the crypto market, the Pepe Coin buyers manage to sustain above the combined support of $0.00000105 and 78.6% Fibonacci retracement level. In the daily time frame chart the coin price shows a formation of a morning star at the aforementioned support indicating an upcoming reversal.
This second reversal from the PEPE price within a month indicates the potential development of a double bottom pattern. This chart pattern is often spotted at the bottom of a downtrend, leading to a sharp bullish recovery.
By the press time, the Pepe coin trades at $0.000113 with an intraday gain of 0.88%. Under the influence of this chart pattern, the anticipated upswing should lead the popular memecoin 28.8% higher to challenge the $0.00000147 neckline.
Is It The Right Time to Buy Pepe Coin?
In theory, a correction fall to 78.6% FIB level reflects some weakness in bullish momentum. Therefore, interested market participants must remain cautious and can wait for a break above the 0.00000147 neckline for a safer entry. This breakout will offer buyers a better confirmation for a bullish recovery and could push the prices back to a $0.00000188 swing high.
- Relative Strength Index: concerning the two bounce-backs from the $0.000105 support, the daily RSI slope shows an evident rise indicating a high possibility of price reversal.
- Exponential Moving Averages: The downsloping EMAs(20, 50, and 100) could exert in-between resistances before the buyers reach the $0.00000147 neckline.
Recent Posts
- Price Analysis
Expert Predicts Ethereum Price Rebound to $4k as BitMine, Long-Term Holders Buy
Ethereum price rose by 1.5% today and moved slightly above the important resistance level at…
- Price Analysis
Bitcoin Price Prediction Ahead of FOMC Minutes
Bitcoin price continues trading within a tightening range, with BTC price holding between $88,000 and…
- Price Analysis
U.S. Government Shutdown Looms: These 3 Crypto Predictions Could Explode
As the January trading session unfolds, the crypto market rose 1.07% in 24 hours, showing…
- Price Analysis
Grayscale Files for First U.S. Bittensor ETF: Will TAO Price Rally to $300 in January?
Bittensor (TAO) price climbed above $220 in the last 24 hours after Grayscale filed for…
- Price Analysis
Shiba Inu Price Prediction: Will SHIB Show Golden Cross Signal in 2026?
Discussion around a potential Golden Cross in 2026 has intensified as Shina Inu price compresses…
- Price Analysis
Pi Network Price Prediction as Demand Slips Ahead of the 136m Unlock
Pi Network price is stuck in a bear market this month, and odds are high…