Pepecoin Price Coiling for Potential Leap; Is $0.000002 the Next Target?


The fast-recovering Pepecoin price takes a breather above $0.00000151 support. This slight detour shows alternate green and red candles indicating uncertainty among market participants. However, a closer look at the lower time frame chart revealed this consolidation as the formation of a famous bullish continuation pattern called pennant. Here’s how this pattern could influence the near further growth of this frog-theme memecoin.
Also Read: Pepe Coin Skyrockets 40%, Will SHIB, DOGE, and FLOKI Follow?
Pepecoin Price Daily Chart
- The area between the triangle structure for the pennant pattern can be considered a no-trading zone.
- The current correction phase stays above the 32.6% Fibonacci retracement level, indicating the overall trend remains bullish
- The 24-hour trading volume in the Pepecoin coin is $241.5 Million, indicating a 0.5 % gain.
 Source-Tradingview
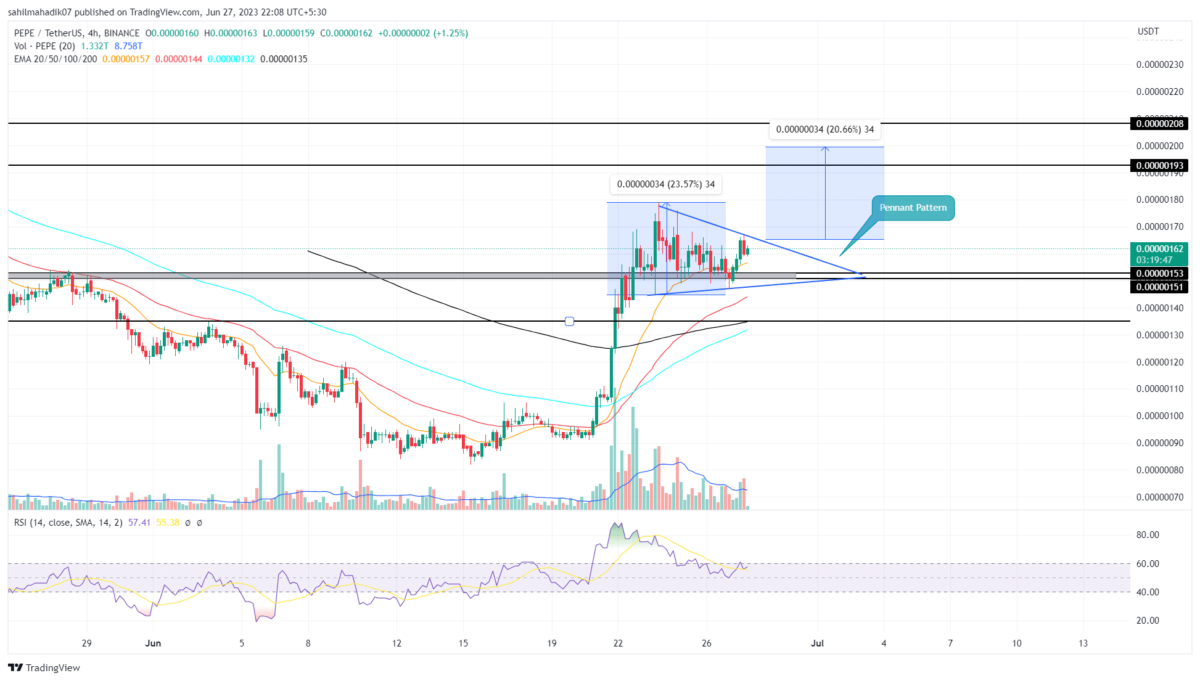
In the 4-hour time frame chart, Pepecoin shows the formation of a pennant pattern. This pattern has emerged as the buyers would need a short break before resuming the prevailing uptrend.
This consolidation will potentially replenish the exhausted bullish momentum and absorb the build-up selling pressure. By the press time, the PEPE price trades at $0.00000161 and continues to resonate within the triangle structure of this pattern.
The most common outlook of this pattern would be a breakout above the overhead trendline and offer new entry opportunities to buyers. The potential breakout could boost buying pressure and push the price to $0.00000193, followed by $0.00000208.
Can Pepecoin Price Fall Back to $0.00000135?
In theory, the pennant pattern offers a brief break period to recuperate the bullish momentum. Therefore, after the aggressive rally last week, the PEPE price is likely to remain sideways for a couple of days before reinitiating the bullish rally. However, in an unlikely scenario, a breakdown below the support trendline will undermine the bullish thesis and may plunge the coin price to $0.00000135.
- Relative Strength Index: The daily RSI slope value sustaining above the 50% mark indicates the bullish momentum is active.
- Exponential Moving Average: The 4-hour EMAs(50 and 100) catching up to the bullish trend indicate the coin price is getting stabilized probably for the higher rally.

Why Trust CoinGape
CoinGape has covered the cryptocurrency industry since 2017, aiming to provide informative insights Read more…to our readers. Our journal analysts bring years of experience in market analysis and blockchain technology to ensure factual accuracy and balanced reporting. By following our Editorial Policy, our writers verify every source, fact-check each story, rely on reputable sources, and attribute quotes and media correctly. We also follow a rigorous Review Methodology when evaluating exchanges and tools. From emerging blockchain projects and coin launches to industry events and technical developments, we cover all facets of the digital asset space with unwavering commitment to timely, relevant information.

Related Articles


- Expert Predicts Bitcoin Dip to $49K as ‘Trump Insider’ Whale Dumps 5,000 BTC
- Bitcoin Price Rebounds $70K, Here are the Top Reasons Why?
- Crypto Market Weekly Recap: Crypto Bill White House Meeting, Binance Buys $1B BTC, and More (9- Feb 13)
- TRUMP Coin Pumps 5% as Canary Capital Amends ETF Filing With New Details
- Crypto Prices Surge Today: BTC, ETH, XRP, SOL Soar Despite US Government Shutdown
- Crypto Price Prediction For This Week: Dogecoin, Solana and Cardano
- Bitcoin Price Prediction: How Could Brazil’s Strategic Bitcoin Reserve Proposal Impact BTC?
- 3 Top Reasons Pi Network Price Surging Today (14 Feb)
- XRP Price Prediction Ahead of Potential U.S. Government Shutdown Today
- Bitcoin Price Outlook As Gold And Silver Lose $3.6 Trillion in Market Value
- XRP and Ethereum Price Prediction as Trump Seeks to Lower Key Tariffs


