Polygon Price Analysis: MATIC Approaches 50-day EMA; More Downside Toward $0.60


The Polygon (MATIC) price continues with its downside momentum following the break of the week-long rally. Currently, the price finds no sign of slowing down after dropping below the psychological $0.80 mark. As of publication time, MATIC/USD reads at $0.74, down 3.66% for the day. According to CoinMarketCap, the 24-hour trading volume fell more than 10% to $815,456.
- MATIC price after breaking below $0.80 continues to slide down with heavy volume.
- More a downside if the price closes below $0.70 on the daily basis.
- MATIC depreciated more than 20% from the swing high of $0.97 in the past week.
MATIC price fell sharply
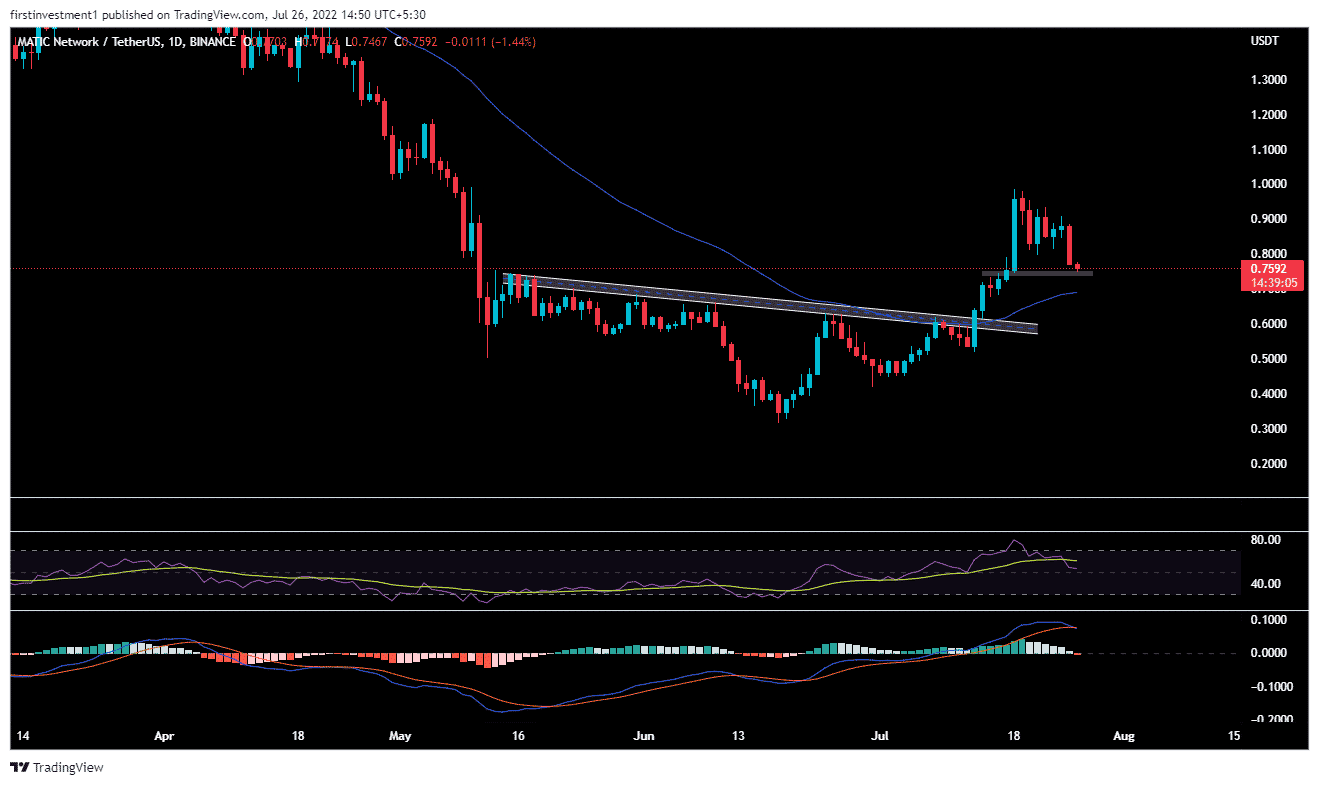
On the daily chart, the MATIC price formed an ‘Inverted Head & Shoulder’ pattern, which is a bullish formation. Finally, a breakout on July 13 resulted in an impulse move. The price tagged the high of $0.97 on July 18.
However, the bulls failed to capitalize on the gains and continues to fall down from the highs. Two consecutive red candlesticks suggest that bears are not going up easily.
A break below $0.70 would confirm another leg-down in the asset. The immediate support could be found around the $0.60 mark.
The RSI (14) fell below the average line with a bearish bias. It reads at 50. Another momentum indicator, the MACD bullish momentum slows down.

On two hourly time frames, MATIC is looking bullish in the short term. The price is moving inside the descending channel. The formation of a bullish Flag & Pole pattern found reliable support near the 50% Fibonacci retracement level.
A break from the current support that is placed near $0.7495, then we can expect a fall up to $0.6895.
On the flip side, a sustained buying pressure from the lower level could see an upside toward $0.8155, followed by a $0.905 level.
Conclusion
On the higher time frame, MATIC is bearish as it’s broken key support level. Even in the shorter time frame, the price at very good support, which is expected to break the downside.
Why Trust CoinGape
CoinGape has covered the cryptocurrency industry since 2017, aiming to provide informative insights Read more…to our readers. Our journal analysts bring years of experience in market analysis and blockchain technology to ensure factual accuracy and balanced reporting. By following our Editorial Policy, our writers verify every source, fact-check each story, rely on reputable sources, and attribute quotes and media correctly. We also follow a rigorous Review Methodology when evaluating exchanges and tools. From emerging blockchain projects and coin launches to industry events and technical developments, we cover all facets of the digital asset space with unwavering commitment to timely, relevant information.