Ripple Price Analysis: XRP Retest Crucial Support Near $0.36; Time To Enter?


XRP price analysis shows sideways movement with no clear directional bias. The price moves lower for the five consecutive sessions. lack of volatility results in smaller price action. This, indicates lack of investors interest in the seventh largest cryptocurrenyc by market cap. After testing the swing highs near $0.41, the XRP price is falling continously.
- XRP price trades with modest losses on Thursday.
- A daily candlestick above $0.38 would result in the continuation of the upside momentum.
- A fall below the critical 50-day EMA at $0.36 will reign in more losses.
As of publication time, XRP/USD is trading at $0.36, down 0.12% for the day. The 24-hour trading volume dropped more than 14% to $951,567,211 according to the CoinMarketCap data.
XRP price extends consolidation
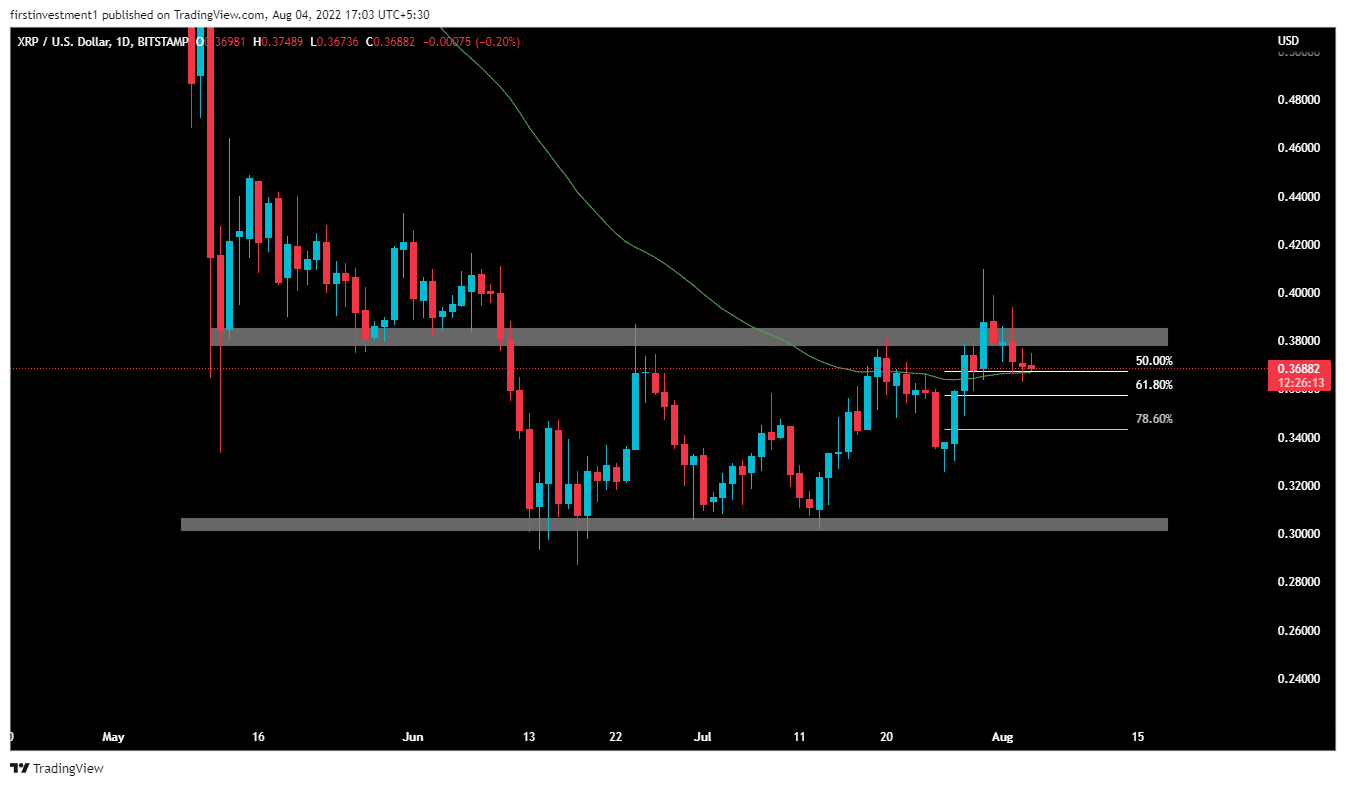
XRP traded in a short-term consolidation pattern since June 12. After testing the tripple supprot near $0.30 on July 26, the price moved in an uptrend , making higher highs and higher lows. On July 28, the price gave a breakout of the 50-day moving average. Currently, the XRP price is retesting the breakout level placed near $0.36.
After giving an impulse move from $0.32 to $0.41, XRP’s price takes a retracement from a higher level to the 50% Fibonacci level, which is at $0.365.
The daily chart shows XRP’s price formed a substantial support zone from $0.35 to $0.36. At the same time, the nearest resistance is at $0.388. If the price is able to close above $0.388, with good volumes then we can expect a good to bullish momentum up to the highs at $0.41.
On the flip side, a renwed selling pressure could drag the price lower. A break below the critical supprot of $0.36 will bring more losses in the token. In that case, the first downside would be $0.34 followed by the low of July 26 at $0.32.
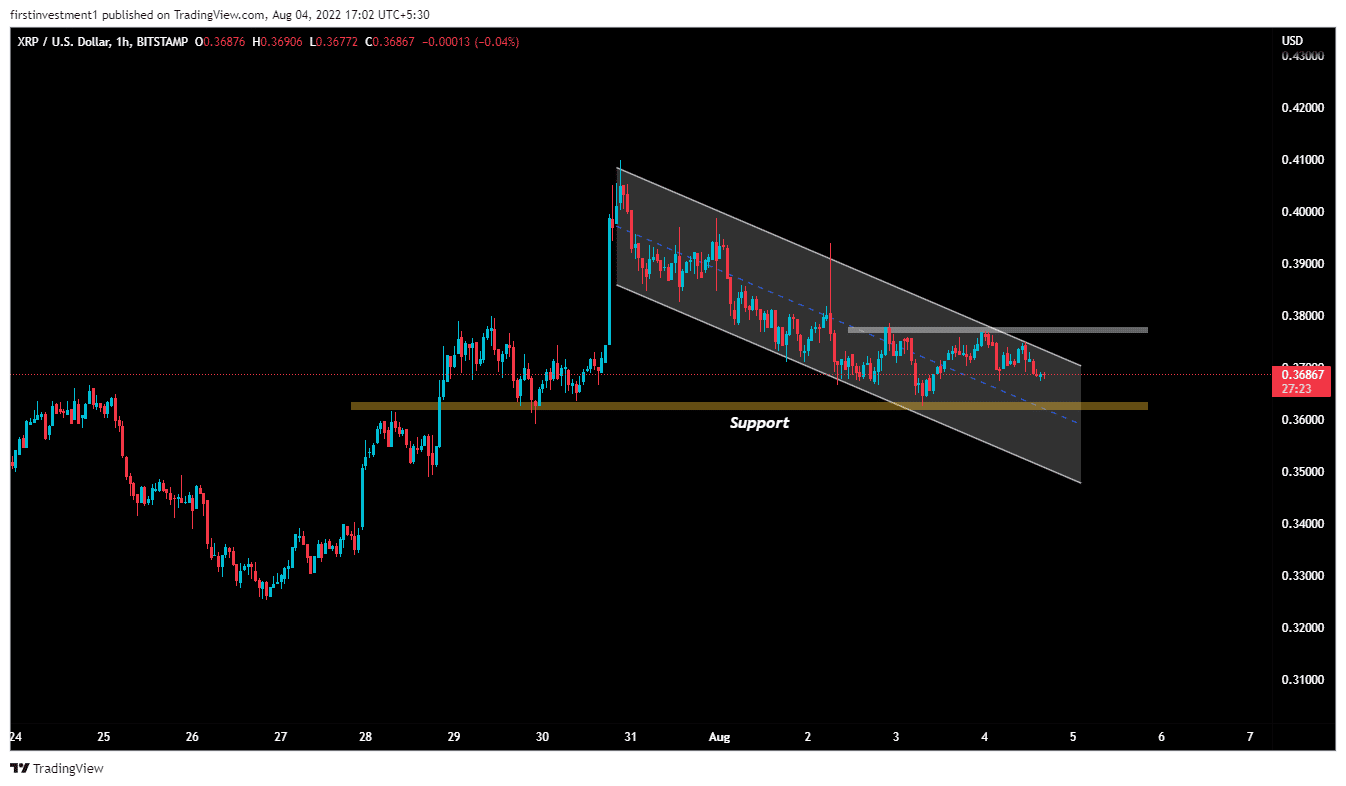
On the hourly time frame, the price is forming a bullish flag and pole pattern, with very good support at $0.365. According to this pattern, If the price breaks above $0.3715, then we can expect a good bullish momentum of up to $0.38.
On the other hand, a break below the $0.3610 level could invalidate the bullish outlook. And the price can be below $0.34.
XRP price make yearly lows of $0.28 in June. Since then the price has appreciated nealry 46% in one-month. A strong resistance is placed around $0.40, to break the short-term downtrend the bulls must bring fresh tradign impetus.
XRP is bullish on all time frames. Above $0.3715 closing on the hourly time frame, we can put a trade on the Buy side.

Why Trust CoinGape
CoinGape has covered the cryptocurrency industry since 2017, aiming to provide informative insights Read more…to our readers. Our journal analysts bring years of experience in market analysis and blockchain technology to ensure factual accuracy and balanced reporting. By following our Editorial Policy, our writers verify every source, fact-check each story, rely on reputable sources, and attribute quotes and media correctly. We also follow a rigorous Review Methodology when evaluating exchanges and tools. From emerging blockchain projects and coin launches to industry events and technical developments, we cover all facets of the digital asset space with unwavering commitment to timely, relevant information.
Related Articles


- CLARITY Act: Bessent Slams Coinbase CEO, Calls for Compromise in White House Meeting Today
- Crypto Traders Reduce Fed Rate Cut Expectations Even as Expert Calls Fed Chair Nominee Kevin Warsh ‘Dovish’
- Crypto, Banks Clash Over Fed’s Proposed ‘Skinny’ Accounts Ahead of White House Crypto Meeting
- XRP News: Ripple Expands Custody Services to Ethereum and Solana Staking
- Bernstein Downplays Bitcoin Bear Market Jitters, Predicts Rally To $150k This Year
- Cardano Price Prediction as Bitcoin Stuggles Around $70k
- Bitcoin Price at Risk of Falling to $60k as Goldman Sachs Issues Major Warning on US Stocks
- Pi Network Price Outlook Ahead of This Week’s 82M Token Unlock: What’s Next for Pi?
- Bitcoin and XRP Price Prediction as China Calls on Banks to Sell US Treasuries
- Ethereum Price Prediction Ahead of Feb 10 White House Stablecoin Meeting
- Cardano Price Prediction as Midnight Token Soars 15%


