SHIB Price Prediction: Is Shiba Inu Recovery from $0.000007 Sustainable?


From mid-August to mid-September, the SHIB price trajectory has been primarily downward, plunging from $0.00001136 to $0.00000695, registering a 38% loss. This decline effectively nullified all the profits earned during the July rally, even diving beneath the 61.8% Fibonacci retracement level. However, with Bitcoin making a comeback from the $25,000 mark, renewed interest and buying pressure in the crypto market have rebounded the SHIB price from its $0.000007 base. But is this surge substantial enough to indicate a bullish turnaround for this Dog-themed memecoin?
Also Read: Shiba Inu, Cardano And Everlodge – The Best Cryptos To Get For Substantial Gains This Fall
Bullish Reversal From Key Support Hints 15% Jump Ahead
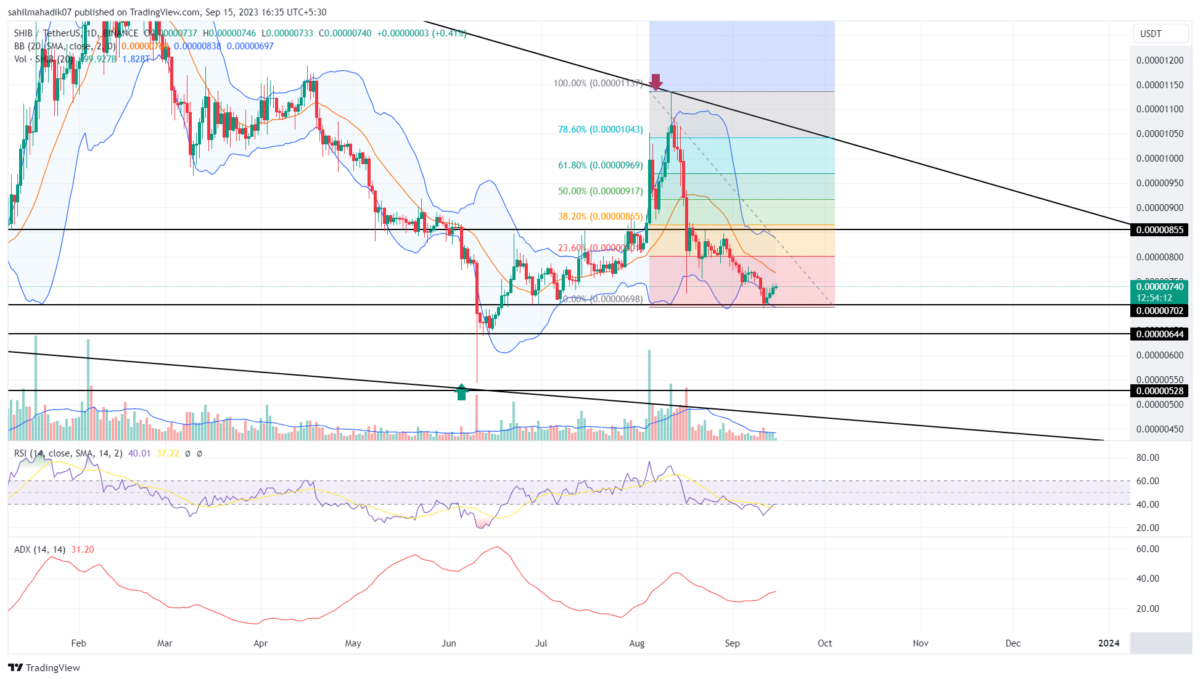
- A V-top reversal in the daily chart reflects an aggressive correction trend
- The SHIB price witnessed demand pressure near the $0.000007 mark.
- The intraday trading volume of the Shiba Inu coin is $73 Million, showing a 1.53% gain.
 Source- Tradingview
Following the current reversal sentiment, the Shiba Inu coin price has ascended for four straight days. Starting its climb from the crucial $0.000007 level, it has experienced a 5% increment, presently settling at $0.0000078.
Yet, given the sheer intensity of the bearish thrust seen during its recent downturn, this slight northward shift from the $0.000007 mark might not be adequate to assure a lasting recovery. Hence, the traders might observe the SHIB price meandering above the aforementioned level as it consolidates and builds buying momentum.
If this buying momentum is maintained, the memecoin holders could see the coin price elevating by another 15% to approach the next resistance at $0.00000855.
What If SHIB Price Loses $0.000007 Support?
While the predominant trend for Shiba Inu remains bearish. Any dip below the $0.000007 benchmark might unleash additional selling pressure, potentially causing the coin price to drop to $0.00000644, and if the bearish momentum persists, even further to $0.0000055.
- Bollinger Bands: The lower boundary’s downtick on the Bollinger Bands suggests the sellers are continuing to exert their force.
- Average Directional Index (ADX): A surge around the 31% mark in the daily ADX trajectory signifies that sellers might continue to drive the current corrective phase.

Why Trust CoinGape
CoinGape has covered the cryptocurrency industry since 2017, aiming to provide informative insights Read more…to our readers. Our journal analysts bring years of experience in market analysis and blockchain technology to ensure factual accuracy and balanced reporting. By following our Editorial Policy, our writers verify every source, fact-check each story, rely on reputable sources, and attribute quotes and media correctly. We also follow a rigorous Review Methodology when evaluating exchanges and tools. From emerging blockchain projects and coin launches to industry events and technical developments, we cover all facets of the digital asset space with unwavering commitment to timely, relevant information.

Related Articles


- Saylor’s Strategy Hints at Bigger Bitcoin Buy Amid $5B Unrealized Losses
- Crypto Market Today: Pi, Pepe, DOGE, and XRP Post Double-Digit Gains
- Trump-Backed American Bitcoin Reserves Surpass 6,000 BTC, Now Worth $425.82M
- Expert Predicts Bitcoin Dip to $49K as ‘Trump Insider’ Whale Dumps 5,000 BTC
- Bitcoin Price Rebounds $70K, Here are the Top Reasons Why?
- Crypto Price Prediction For This Week: Dogecoin, Solana and Cardano
- Bitcoin Price Prediction: How Could Brazil’s Strategic Bitcoin Reserve Proposal Impact BTC?
- 3 Top Reasons Pi Network Price Surging Today (14 Feb)
- XRP Price Prediction Ahead of Potential U.S. Government Shutdown Today
- Bitcoin Price Outlook As Gold And Silver Lose $3.6 Trillion in Market Value
- XRP and Ethereum Price Prediction as Trump Seeks to Lower Key Tariffs


