Shiba Inu Price Prediction: Here’s Why $SHIB is at Risk of 22% Drop


Shiba Inu Price Prediction: With the increasing uncertainty in the crypto market, the Shiba Inu price recovery faced a sharp reversal from the $0.0000106 mark. This reversal occurred at the resistance trendline of the long-coming resistance trendline, creating a better position for the correction phase. Should you sell this anticipated downfall or keep holding?
Also Read: Shiba Inu Burn Rate Soars 83000% As Whale Shifts 4 Tln SHIB
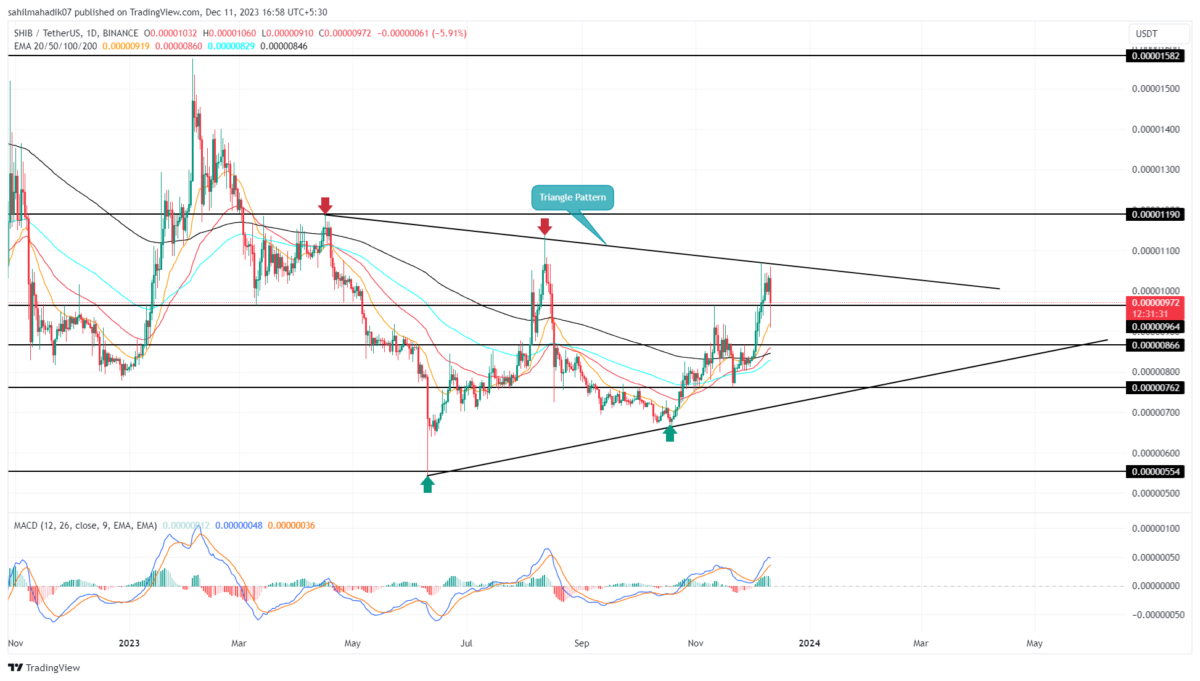
Triangle Pattern Signals Minor Correction
- A sideways trend under the influence of a symmetrical triangle pattern indicates an accumulation phase.
- The anticipated drop in SHIB price can find demand pressure at $0.0000096, followed by $0.00000764
- The intraday trading volume of Shiba Inu is at $382 Million with a 12.6% loss.

The last 8 months’ price behavior in the Shiba Inu coin portrays a sideways action as the huge price swing witnessed did not contribute in either direction. However, if we connect the price peaks with the trendline, the daily chart shows the formation of a symmetrical triangle pattern.
Under the influence of this triangle, this Shiba Inu price is likely to squeeze in a narrow range building enough momentum for the next leap. With today’s sell-off in the crypto market, the SHIB price reverted from the pattern’s upper trendline, projecting a possibility of another bear cycle.
By the press time, the SHIB price trades at $0.00000973, with an intraday loss of 6%. If the coin price breaks below the immediate support of $0.00000964, the sellers would gain sufficient momentum to prolong the downward trend.
The post-breakdown fall could plunge the price 22% down to hit a lower trendline near $0.0000076.
Is SHIB Price Ready For a Bull Run?
While the short-term outlook for SHIB price could be bearish, the triangle pattern would influence a sideways trend for the coming weeks or months. However, the coin holders looking for a direction move must wait for a breakout from the triangle boundaries. A potential breakout from upper resistance will surge the prices to $0.00000119, followed by $0.00000158
- Moving Average Convergence Divergence: A bullish crossover state between the MACD(blue) and signal(orange) indicates the recovery trend is intact.
- Exponential Moving Average: The 20-day EMA slope is offering support to the current downswing in SHIB price.

Why Trust CoinGape
CoinGape has covered the cryptocurrency industry since 2017, aiming to provide informative insights Read more…to our readers. Our journal analysts bring years of experience in market analysis and blockchain technology to ensure factual accuracy and balanced reporting. By following our Editorial Policy, our writers verify every source, fact-check each story, rely on reputable sources, and attribute quotes and media correctly. We also follow a rigorous Review Methodology when evaluating exchanges and tools. From emerging blockchain projects and coin launches to industry events and technical developments, we cover all facets of the digital asset space with unwavering commitment to timely, relevant information.
24 Hours volume
$224.66M
Market Cap
$4.14B
Max Supply
1000T

Related Articles


- Expert Predicts Bitcoin Dip to $49K as ‘Trump Insider’ Whale Dumps 5,000 BTC
- Bitcoin Price Rebounds $70K, Here are the Top Reasons Why?
- Crypto Market Weekly Recap: Crypto Bill White House Meeting, Binance Buys $1B BTC, and More (9- Feb 13)
- TRUMP Coin Pumps 5% as Canary Capital Amends ETF Filing With New Details
- Crypto Prices Surge Today: BTC, ETH, XRP, SOL Soar Despite US Government Shutdown
- Crypto Price Prediction For the Week Ahead: Dogecoin, Solana and Cardano
- Bitcoin Price Prediction: How Could Brazil’s Strategic Bitcoin Reserve Proposal Impact BTC?
- 3 Top Reasons Pi Network Price Surging Today (14 Feb)
- XRP Price Prediction Ahead of Potential U.S. Government Shutdown Today
- Bitcoin Price Outlook As Gold And Silver Lose $3.6 Trillion in Market Value
- XRP and Ethereum Price Prediction as Trump Seeks to Lower Key Tariffs


