Solana Price Analysis: Will $SOL Price Surpass $27 Amidst Current Recovery Cycle?


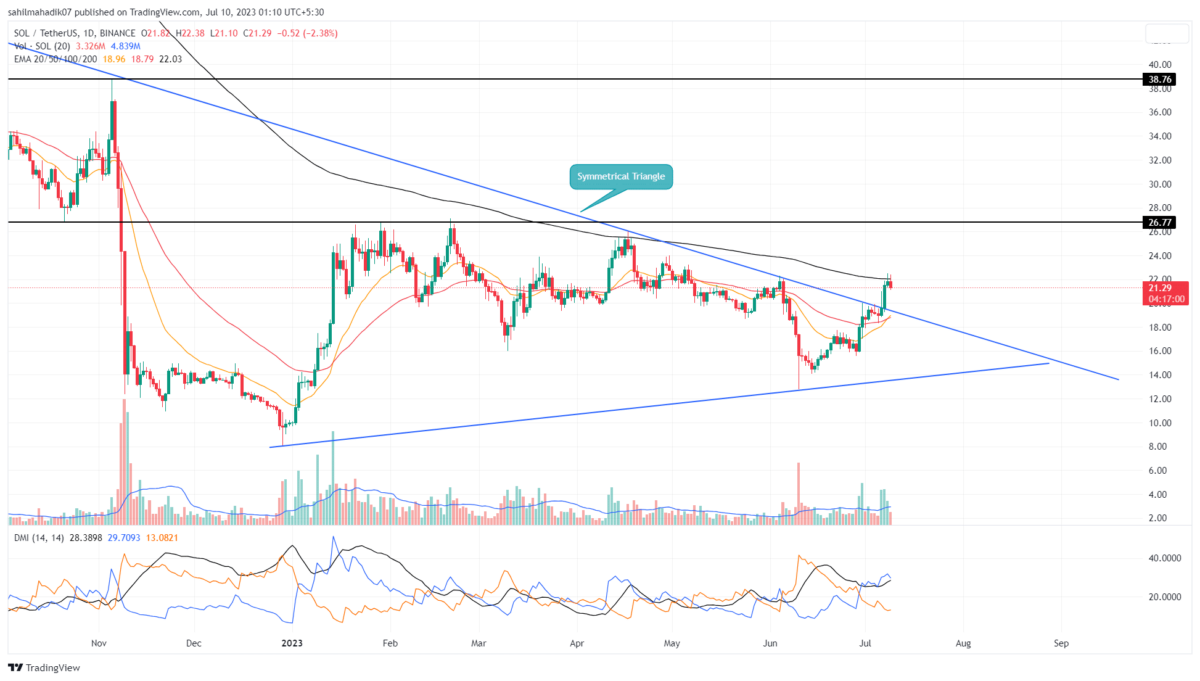
Solana Price Analysis: Over the past seven months, the Solana price traveled in a sideways trend during which it resonated between two converging trendlines acting as major resistance and support. In the daily time frame chart, this trendline structure projected the formation of a symmetrical triangle pattern, offering an opportunity for a directional move upon the breakout of either trendline. Amid the recent growth in the crypto market, the SOL buyers provided a bullish breakout from the triangle pattern, paying the way for further recovery in the near future.
Also Read: Solana Price Recovery: Analyst Sets $27 Price Target for $SOL
Solana Price Daily Chart
- A symmetrical triangle pattern resulted on a bullish note projecting a significant rally underway
- A bullish crossover between the 20-and-100-day EMA project additional confirmation
- The 24-hour trading volume on the Solana coin is $146.5 Million, indicating a 37% loss.
 Source-Tradingview
On July 7th, the fast recovery Solana price provided a massive breakout from the resistance trendline of a symmetrical triangle pattern. The following day, the coin price offered a follow-up green candle but the higher price rejection reflected the selling pressure rising.
However, this rejection candle could be profit booking from short-term traders suggesting a minor pullback is possible before the next leap. Currently, the SOL price trades at $21.3 and shows an intraday loss of 2.34%.
This potential pullback could plunge the price by 10% to retest the breach trendline and recuperate the bullish momentum.
Will Solana Price Rise to $27?
After a remarkable recovery in the last four weeks, the Solana price is likely to take a short break before the bull run continues. The pullback could be beneficial for buyers to restore bullish momentum and check price stability at a higher price. If prices manage to sustain above the breach trendline, the buyers could drive a 25% rally and hit the next supply zone of $27, followed by $38.7.
- Exponential Moving Average:: The SOL price turned down from the 200-day EMA resistance stands as the last barrier for sellers to reclaim higher prices.
- Directional Movement Index: The DI+ slope(blue) above the DI- line(orange) and moving further reflect the rising buying pressure among traders.

Why Trust CoinGape
CoinGape has covered the cryptocurrency industry since 2017, aiming to provide informative insights Read more…to our readers. Our journal analysts bring years of experience in market analysis and blockchain technology to ensure factual accuracy and balanced reporting. By following our Editorial Policy, our writers verify every source, fact-check each story, rely on reputable sources, and attribute quotes and media correctly. We also follow a rigorous Review Methodology when evaluating exchanges and tools. From emerging blockchain projects and coin launches to industry events and technical developments, we cover all facets of the digital asset space with unwavering commitment to timely, relevant information.